Power BI is a business-based tool, developed by Microsoft for better visualization of data. Power BI is a business intelligence-based platform used for power purposes and tasks available in Microsoft. It was released initially in 2014 by Microsoft but a stable version was available in 2021 a year ago. The main purpose behind releasing the stable version is due to high-level glitches and instability issues (crashed often). Many organizations also use Microsoft Power BI consulting services to set up the platform and improve their reporting process.
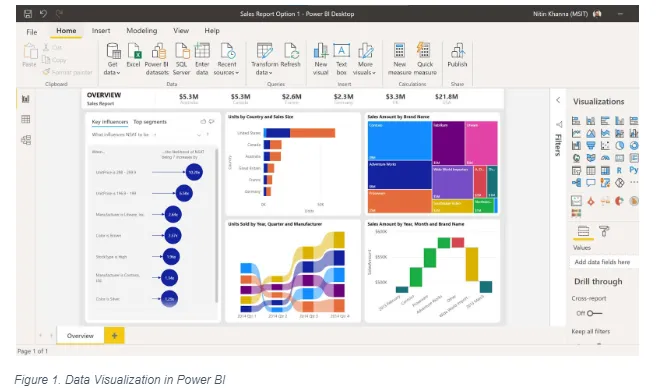
The main purpose behind this software or application is to convert coherent and non-linear data into visually aesthetic graphical representations based on which the analysis and results can become easier for students, businessmen, researchers, and engineers. The data that can be given as input to the software can be in the form of an Excel spreadsheet or any other software-based format.
Generally, this software is free for desktops but top variants like Power BI Pro, Power BI Premium, and PPU are paid. The main feature that interacts with the new user is that it is easy to use and can be advantageous for young learners.
Relation of Power BI with Web Applications
Different parameters are required to monitor while managing a website. These features or parameters include dashboards, graphs, and analytical values. When web applications are integrated with Power BI, businesses get complete analytics in a clear visual format, while also selecting the right Power BI license types based on usage, users, and reporting needs.
This solution is widely used by large organizations and companies that need to promote their products at scale. It is especially useful for websites or applications running ad promotions, as Power BI reports, supported by appropriate Power BI license types, help track performance and accurately measure how much income has been generated.
Requirements for Integration
Many specifications are required by the Power BI software to run and work properly. A professional software development company would ensure these requirements are met, including the nature of the framework, code, and even the browser used by the end user. The framework required for the integration is the .NET Framework and .NET Core, and the integration supports only specific browsers, namely Microsoft Edge, Firefox, and Google Chrome.
There are simple steps that should be followed to integrate your organizational or personal website with Power BI, and a Power BI course can help learners understand this process more clearly.
- Registration: The main step in the integration of Power BI requires registration. A person, system, or organization must have registered with Microsoft Azure. This requirement is necessary as it gives a unique identity to the system that will be used by the organization.
- Creating a Workspace: While working with the flow the second prominent step is to create a workspace in the window. The main purpose of creating a workspace is to embed all the dashboards including reports, graphs, and other visualizations.
- Report: After creating the workspace, uploading your raw data, and creating the workspace the next step is to create a report. The report has all the data in the form of the dashboard that has been created.
- Parameter Values: After generating a report now one can adjust the parametric values of all the graphs, visualizations, and other reports.
- Embedding: in the final step embed all your data. This data can be obtained in the form of a CSV file, Excel file, or PDF. By doing so, one can manage all the data of the organization otherwise doing the same work in other embedded software can lead to the complexion, that is the reason it is most widely embedded with different web applications to get the data of a site or applications.
Also Read: How Much Does Power BI Cost?
Advantages of Power BI
For the past two years, Power BI has been mostly used with web applications. The reason is simple Power BI is open source and can be learned easily that is the reason big organizations focus on this thing as it requires less input from the user in terms of time, money, or other hard work. There are other reasons as well, which are as follows:
- This Power BI is mostly used for business websites, as it provides all the machine learning, deep learning, and artificial intelligence-based algorithms required to run business websites. As it generates reports that include income, using hours, and all other relevant data.
- By using Power BI, the aesthetics of the data becomes prominent. The data provided to Power BI Desktop is often in discrete form, but with the expertise of skilled professionals, the data comes to life through better visualizations. Businesses can hire Power BI developers to transform raw data into meaningful insights and impactful dashboards.
- It is a secure platform, as multinational organizations require the security of their data. That is the reason it is more widely used in business-based applications.
- The data can be connected in Power BI and can be of various types. You can send data even in the form of Excel or CSV files as well.
- It has an artificial intelligence-based algorithm already embedded which gives alarms and beware to the user if the software observes some kind of abnormality and even in some cases can do necessary steps all by itself by observing the trends in the data.
- With the help of such apps, sharing can become easy as it can be used as a drive as well.
- Continuous latest versions have been updated regularly which tells us that it improved day by day which is why it is the most widely used extension used in web applications.
Microsoft Power BI is an incredibly powerful and cost-effective tool for addressing an organization’s business intelligence needs. To truly maximize its potential, however, you may benefit from professional Microsoft Power BI consulting services. These services can help identify gaps in your current data strategy, establish a robust business intelligence infrastructure, and provide comprehensive training to empower your team to fully leverage the software. As a trusted Data Consulting firm, Algoscale brings the expertise, tools, and strategic guidance needed to help your organisation unlock the full value of Power BI from initial setup and data modelling to advanced dashboard development and ongoing optimisation. If you believe your organisation could benefit from expert Power BI guidance,, let’s connect.