


Not using performance analytics today is like navigating a busy street with an old paper roadmap- slow, blind to real-time changes, and inefficient to guide riders on traffic routes in the age of GPS. Performance analytics is the foundation of data-driven decision making for modern businesses as it enables them to use data to understand what is working, what is not, and identify areas of improvement.
It systematically measures and evaluates all business activities to assess the gap between organizations reaching their strategic goals. As an enabler of data-driven decision-making, performance analytics transforms raw data into actionable insights that help organizations identify targeted strategies for improvement.
A video streaming service like Netflix uses performance analytics to track if audiences enjoy a show (by tracking indicators like how many people start watching a show, where they stop watching, how many complete it) to understand if the show worked, analyse viewing patterns (what a user watched before, what similar users watch and when they watch it) to deliver recommendations that matter, and measure video streaming speed in a city (by measuring buffer time, app crashes, or internet speeds) to manage traffic and optimize servers for top notch performance.
This blog will help you understand why performance analytics matters for businesses today, the different use cases it caters to across industries, how it relates to business intelligence, how it works, and how you can implement performance analytics from scratch navigating common implementation challenges.
What is Performance Analytics?
The systematic process of collecting, analysing, and presenting data to obtain granular understanding of how an organization, its individual departments, products, or services are working is known as performance analytics. It uses key performance indicators designed for specific objectives to show if the organization is on track to meet them.
These specific metrics assess how an organization is meeting its objectives, providing a measurable way of attaining set goals. When your first set of objectives are met, the next performance targets are set to meet business goals in order of priority. However, if any goals are not achieved, performance analytics can help you pinpoint why they weren’t met, and which strategies or implementation measures need to be optimized to take you closer to your predefined goals.
Let’s take a hypothetical example of how this would work for an e-commerce company striving to increase their online sales by 20% over the next one year.
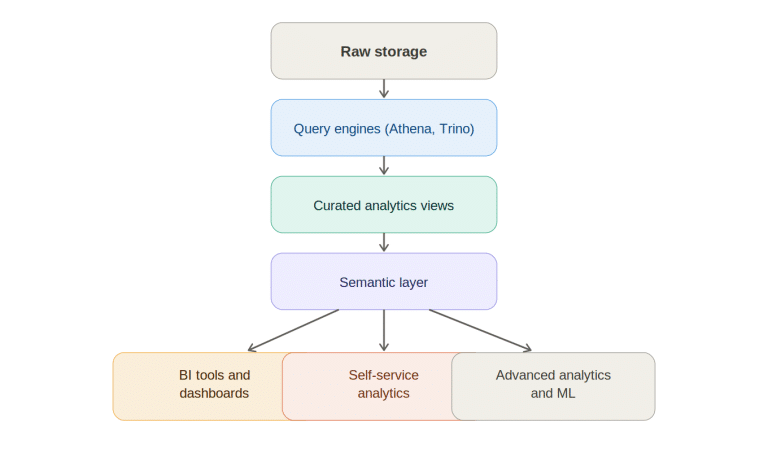
The process begins with collecting data from various sources to build a unified data pipeline with data from website analytics, customer behaviour, sales data and inventory logs into a central data warehouse. Next, interactive dashboards are built using data visualization tools like Power BI to track each KPI in real time and identify hidden correlations and patterns.
Explore: Data Visualization Consulting Services
E-commerce performance analytics would require them to track KPIs like number of site visits in a month, average order value, cart abandonment rate, conversion rate, and customer repeat purchase rate among others. This is where expert analysts identify KPIs that best help you assess pre-defined goals. These KPIs measure different aspects like marketing reach, pricing effectiveness, user experience, and inventory relevance to offer a holistic view of sales enablers and their efficacy, pinpointing opportunities for improvement and future growth.
From dashboard creation, usage of advanced analytics, insight generation, and actionable strategies to optimize underperforming areas in the online sales funnel, performance analytics is a powerful medium to stay ahead of competition by identifying root causes of overperforming and underperforming aspects, understanding the “why” behind each, and taking measured steps for improvement to reach your goals.
In summary, performance analytics is a strategic enabler for long-term business success and involves data collection, data interpretation, data analysis, data integration, and continuous monitoring to deliver answers for gaps to be filled to meet your customer success, employee engagement, operational efficiency, sales, and revenue goals. This often requires integrating various internal records, such as an employee database, to ensure HR metrics are accurately represented in the broader performance landscape.
Also explore: Data Integration Consulting Services
Is Performance Analytics Worth The Investment?
According to a report by DataBridge Market Research, the global performance analytics market was valued at USD 3.99 billion in 2024 and is projected to reach USD 9.72 billion in 2032, growing at a CAGR of 11.77% during the forecast period.
As more and more businesses feel the need to make sense of the large volumes of data generated by their day-to-day operations and customer interactions, or more leaders recognize the importance of data as an asset for driving revenue growth and competitive edge, the role of performance analytics becomes more evident. By effectively synthesizing various streams of company data, organizations can ensure their analytical frameworks remain aligned with overall business objectives. Not only does it empower data-driven decisions at a faster pace, it also minimizes the time for strategy development by collating insights that matter for each phase in an actionable
With performance analytics, businesses can track and visualize key performance indicators from large volumes of data. This is where the best data visualization companies help businesses transform large chunks of raw and unstructured data into easy to comprehend actionable insights that allow them to understand data at granular levels and anticipate future demands to deliver better results.
Additionally, this is a repeatable and ongoing process, enabling businesses to keep pace with a competitive market, where decisions need to be quick and implementation needs to be smarter. As such, performance analytics creates a runway for sustained growth through cycles of continuous improvement after one goal is met and measured through its set KPIs.
Why Performance Analytics Is Important?
Business metrics and measures of success mean nothing if they cannot truly contribute to actionable strategies for improvement in specific areas. This means you should be able to get granular-level insights from individual aspects of your business through data. This is what performance analytics help you achieve. Discussed below are reasons why performance analytics is important:
1. Quick, Efficient, and Fact-based Decisions
The fast-paced and rapidly evolving digital world has no room for assumption-based decisions. One wrong assumption can cascade irreversible damage across your organization and distance you from desired progress. Performance analytics enables the shift from assumptions to fact and data-based decisions, enabling teams to progress faster with confidence, rely on accurate data, and minimize escalation delays with targeted KPIs, real-time data, and accurate analysis. When analyzing audience behavior, performing a website accessibility audit is essential to ensure your platforms are usable for people with disabilities. Improving accessibility not only broadens your reach but also enhances engagement and overall business performance.
2. Unlocking Revenue Clarity
The major investments in revenue growth for any business include distribution channels, products, customer segments, and marketing activities. Data analytics services with performance analytics help businesses understand which aspect of revenue needs to be prioritized, track growth, and optimize their spending for better ROI.
3. Operational Efficiency
Performance analytics can promptly reveal idle time, areas that need rework, and potential bottlenecks that can slow down progress and compromise overall efficiency. These insights often guide organizations to adopt AI Workflow Automation Software featured in Revoyant to streamline processes and reduce manual effort. This helps businesses optimize their redevelopment efforts, align automation with current and long-term objectives, and consistently maintain service levels with reduced costs and time spent on transitions. Many online businesses also explore powerful all-in-one platforms and funnel builders to further enhance their marketing and sales funnels. For the best options, check out this builderall alternatives guide.
4. Risk Mitigation
Performance analytics enables a systematic analysis of quality, compliance, or safety requirements. This empowers the concerned decision makers within the organization to detect areas which need corrective action and swift address the same to mitigate security and compliance risks.
How Does Performance Analytics Work? The Foundation For Business Intelligence
Performance analytics unlocks business intelligence by transforming complex datasets into clear visuals that make it easy to identify patterns, trends, and bottlenecks within particular areas of your organization and understand actionable strategies for improvement. Described below is the process through which this happens:
- Step 1: Data is collected through multiple touchpoints, including website analytics along with competitor website analytics, sales transactions, marketing campaigns, CRM, customer communications, and support tickets. Following this, visually appealing and comprehensive dashboards are created for updating in real time.
- Step 2: Advanced machine learning algorithms are then deployed for thoroughly analyzing this information and identifying patterns that might be easy for humans to miss.
- Step 3: Experienced analytics experts interpret the findings, identify KPIs and evaluate progress for your defined goals. This is when you can identify opportunities for improvement and incrementally meet growth objectives with confidence.
- Step 4: Ongoing improvement takes place with regular performance assessments to help you adjust your strategies, incorporate mechanisms, and make necessary changes to meet your long-term goals.
Explore: Power BI Consulting Services to connect disparate data sources, clean, transform data, and build interactive dashboards.
As such, performance analytics supports business intelligence by enhancing reporting, dashboards, and historical analysis with a deeper context, providing targeted measurements and opportunities for continuous improvement. It strengthens business intelligence by focussing on the right KPIs, tracking them in real-time, and identifying the root causes behind performance gaps. Real-time visibility into customer behaviour, processes, and operations with performance analytics enhances business intelligence to support improved decision-making.
Not only does performance analytics align data with business objectives, it also empowers leaders to promptly refine strategies by detecting anomalies early on. In summary, it makes business intelligence more meaningful by enabling forecasting and enabling more than surface-level understanding, ensuring measurable objectives can be tracked through every report.
Explore: business intelligence consulting services in greater detail.
What Triggers The High Demand For Performance Analytics?
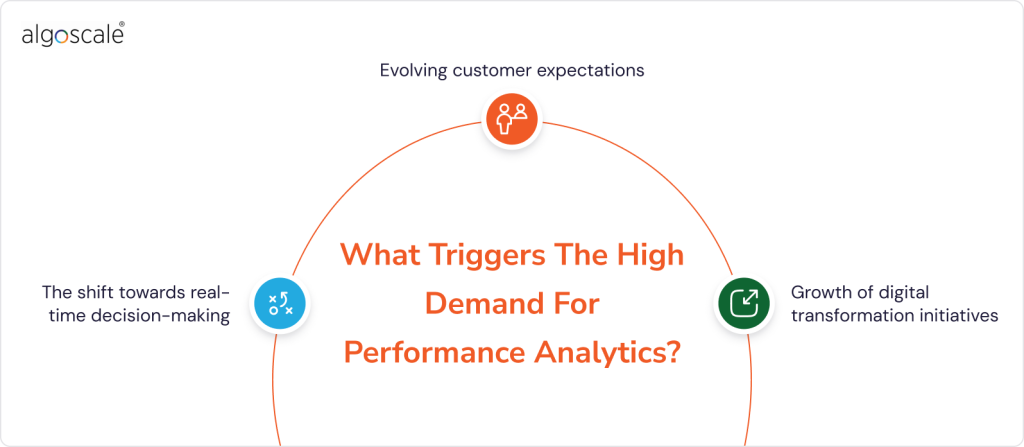
Performance analytics is helping businesses solve and eradicate yesteryear problems like reliance on assumptions, lack of visibility into granular data for each function, and acting without preparation or information in the face of any uncertainty. It is these capabilities that make performance analytics future-proof and trigger its high demand:
- The shift towards real-time decision-making: Organizations whose survival and wins depend on immediate action and change management, such as healthcare, e-commerce, and fintech, cannot afford for weeks or months for their performance reports to see what worked and what didn’t. They need these insights in real time to improve their efficacy and deliver better. Business performance analytics deliver these real-time insights and enable quick strategies to be implemented to minimize damages.
- Evolving customer expectations: This is the era of hyper-personalisation, where each user wants a version of the product most relevant for them. Without a deep understanding of their behaviour and why they act the way they do, no business can deliver the level of personalisation customers expect from their solutions today. User performance data analytics empower businesses with behavioural insights from usage patterns, help them understand customer sentiment, and offer them smooth end-to-end journeys with tailored recommendations.
- Growth of digital transformation initiatives: Companies striving for end-to-end digital transformation need to modernize their legacy systems and processes with cloud, automation, and AI. The end goal of digital transformation is to enable unified business intelligence by integrating data from multiple sources as these technologies scale. Without high performance analytics, organizations will not be able to analyze, process, or interpret large data volumes quickly and at scale, and eventually miss out on the opportunity to measure progress, maximize ROI, and optimize new digital workflows accordingly.
What Is The Difference Between Traditional Performance Reporting vs Performance Analytics?
Historical performance review and performance analytics are complementary to each other but serve different purposes with their unique capabilities and focus areas. Historical performance review offers a retrospective look at past results, providing the broader or overall context for long-term planning and trend identification. This is mostly done quarterly, bi-annually, or annually, and reveals patterns and benchmarks for the same.
Performance analytics, on the other hand, takes a forward-looking approach and offers real-time visibility into processes and trends. It enables a continuous and ongoing approach to understanding the “why” behind organizational performance. The objective of performance analytics is to offer data-driven insights from every aspect of business via real-time dashboards and reports tailored to measurable KPIs for pre-defined goals.
It begins with creating a unified data pipeline by consolidating data into a central warehouse with the help of data warehouse consulting services and enables proactive strategy refinement, optimization, and actionable intelligence for meeting goals through a repeatable process.
| Key Differences | Historical Performance Review | Performance Analytics |
| Focus | Past performances | All-inclusive, past, present, and future. |
| Frequency | Annual or bi-annual | Continuous and ongoing. |
| Method | Subjective, top-down. | Data-driven, real-time KPIs, and dashboards. |
| Implementation | Broad and generic | Focussed, forward looking. |
Tools like ServiceNow performance analytics help businesses manage large volumes of fragmented data with focussed metrics, actionable insights, and clear strategies for maximizing on opportunities. ServiceNow performance analytics convert raw data into meaningful information for improved decision making by tracking and visualizing KPIs targeted to specific business processes. It helps organizations improve their performance and achieve complete business excellence by:
- Offering complete visibility into operations for optimizing business performance in each area.
- Targeting resources for improved service delivery.
- Providing interactive dashboards, robust reporting, and indicators to pinpoint exact data pertaining to each issue.
- Offering features like breakdowns for enabling granular data analysis, data collector for a comprehensive view of metrics, and widgets to make complex data accessible through data visualization.
Industry and Function-Specific Application of Performance Analytics
Described below are instances of how performance analytics re-define business environments across industries:
1. Sales Performance Analytics
Sales performance analytics bridge the gap between projections and actuarial sales by monitoring performance in different markets, consolidating data from customer interactions, CRM systems, sales pipelines, and revenue reports. Sales performance analytics help organizations make sense of this data by defining key metrics like conversion rates, customer acquisition cost, and deal velocity, identifying bottlenecks that lead to lost opportunities, and analyzing trends for optimizing future sales processes.
2. Marketing Performance Analytics
Marketing managers and senior executives use marketing performance analytics to compare and monitor the performance of different marketing strategies, identify which strategies are closer to enabling sales, and optimize the performance of those strategies that potentially align with their goals.
Additionally, they can identify and discontinue strategies that consistently perform poorly, allocating their resources towards meaningful and goal-driven measures. By tracking data from different campaigns, audience interactions, and channels, and analyzing metrics like campaign ROI, ROAS, and user engagement, marketing performance analytics help marketers refine strategies, personalize approaches, and optimize expenses for channels that matter.
3. Application Performance Analytics
In today’s digital-first world, nearly every business is dependent on an app to establish primary communication with customers and deliver their offerings. Customers, on the receiving end, have access to a plethora of options for apps pertaining to their day-to-day activities. As such, all businesses need to ensure that their apps function well and solve users’ problems in the best way possible to stand out from the competition.
This is where application performance analytics help them monitor an app’s speed, stability, and user experience, load time, and crashes to fix it before it becomes a major roadblock leading to user churn. Every industry uses app performance analytics to achieve goals that matter to them- for example, edtech to reduce LMS downtime, e-commerce to minimize checkout barriers, and fintech for offering reliable and instant transactions.
4. Asset Performance Analytics
Manufacturing, energy, and logistics can use asset performance analytics to collect and monitor data from digital and physical assets to understand how to maximize their utilization and efficiency. With the help of sensors, maintenance logs, IoT devices, and tracking of operational systems, these businesses can track asset performance patterns, minimize downtime, predict system failure, and schedule proactive maintenance before these barriers impact smooth functioning and delivery.
5. Provider Performance Analytics
Industries such as healthcare, education, real, and telecom rely heavily on external vendors for their day-to-day operations. Any gap in the provider’s promise and delivery can significantly affect their service quality and hamper credibility for poor user experience. In this context, provider performance analytics closely track and monitor the gap between service providers’ delivery and set expectations, track delivery timelines, service efficiency, customer satisfaction, and compliance metrics, and highlight gaps or vendor risks to help businesses choose the right vendor.
6. Investment Performance Analytics
Banks, financial service providers, wealth advisors, and fintech platforms use investment performance analytics to evaluate how well an investment or financial strategy is performing to meet pre-defined goals. By tracking their performance in varying market conditions and benchmarking them against available options like the .999 fine South African Silver Krugerrand coins that Monex carries, investment performance analytics help financial institutions and experts understand market volatility, cash flows, asset allocation, and risk exposure data for refining underperforming strategies, improve portfolios, and guide smarter financial decisions.
How Do Performance Analytics Connect with Data Visualization and Business Reporting?
In order to track analytical performance, complex data needs to be converted to intuitive visuals that are easy to comprehend while making decisions. Data visualization expertise helps transform performance metrics into intuitive charts, reports, graphs, and dashboards for businesses to understand trends better and make quicker decisions.
This is where top Tableau companies help businesses transform their raw and complex data into interactive, collaborative, and actionable dashboards for smarter decisions. This enables teams to understand their data through visual formats, identify trends and missed opportunities, and learn how different metrics connect with each other, irrespective of their expertise in data interpretation.
Also explore: The Best Power BI Consulting Companies
This highlights the importance of converting raw and complex data into a story that guides business decisions. This is where business reporting helps organizations convert raw analytical data into intuitive visual narratives driving business intelligence, powering data-driven decisions, and offering granular breakdowns of high-level summaries.
What Are The Benefits of Performance Analytics?
In today’s data-driven age, performance analytics is a game-changer for organizations striving to gain a competitive edge, unlock their complete potential, and make sense of every event by understanding why it happened (as opposed to just knowing what happened). Discussed below are the major benefits of performance analytics:

1. Understanding Strengths, Weaknesses, and Areas For Improvement
Performance analytics takes a meticulous data analysis for industry standards, benchmarks, and organizational processes, enabling businesses to identify which areas require improvement. With complete visibility into their strengths and weaknesses, businesses can prioritize refinement strategies, allocate resources wisely, and implement initiatives that guarantee the fastest impact aligning with their goals.
2. Realistic Goals and Actionable Pathway to Growth
Performance analytics helps businesses set realistic goals in alignment with their broad strategic vision. By identifying areas for improvement, analyzing their current performance trends, and understanding which channels can drive the greatest impact, performance analytics helps organizations maximize on growth targets that matter.
3. Responsiveness in a Competitive Market
Actionable data is a strategic enabler for responsiveness and distinction in a competitive market. While top data strategy consulting services help businesses understand how to channel their data for growth, performance analytics converts that strategy into measurable KPIs and actionable insights for improvement. Continuously monitored performance data gives businesses the agility to adapt to an ever changing market, anticipate user needs, and identify market trends ahead of others to remain at the forefront of innovation.
4. Maximizing Productivity
Performance analytics offers granular insights into each organizational process and team dynamics. This in-depth data analysis can reveal inefficiencies, identify time-consuming tasks, and other loopholes that hamper progress and productivity. These insights can help teams optimize their processes, identify and eliminate bottlenecks, achieve more in less time by focussing on what matters, and significantly boost productivity with lower operational costs.
Implementation Challenges Of Performance Analytics Systems
Performance analytics can be a game changer for any business today, but it is necessary to address its implementation challenges and pre-requisites. Some of them are discussed below:
1. Poor Availability of Data
Sufficient data is the first prerequisite for getting a holistic view of performance, determining key indicators, and identifying areas for improvement. In many scenarios, organizations may have difficulty managing their data, lack the expertise to structure their data and convert it to an actionable form, or lack the means to collect sufficient data. top data engineering companies can help organizations create clean and structured data pipelines for KPI tracking and extracting insights, forming the base for powerful performance analytics.
2. Data Complexity
Every business today generates an explosion of data that can be difficult to consolidate, structure, and put to use. The sheer amount of data from multiple sources and the frequency at which it is generated can make it difficult to comprehend. This is where expert data visualization and data engineering services are required to implement advanced statistical techniques, convert data into intuitive visual formats, and extract meaningful information from the same.
3. Poor Data Quality
Inaccurate or inconsistent data cannot be used as the foundation for reliable performance insights. Businesses need to maintain top data quality and accuracy, define accurate systems and flow of data with expert data architecture services and ensure data preparedness for implementing performance analytics.
4. Legacy Systems
Legacy ERP or on-site systems are obsolete in meeting the complex requirements of today’s fast-paced business environment. Data silos, limited processing power of old systems, minimal or no automation, and incompatibility with modern analytics tools make it difficult to gather accurate and clean data. Businesses need to migrate to advanced cloud-based systems that can pace with modern demand and leverage big data consulting services to gather large datasets from which performance analytics can gather insights.
How Can Algoscale Help You Implement Performance Analytics?
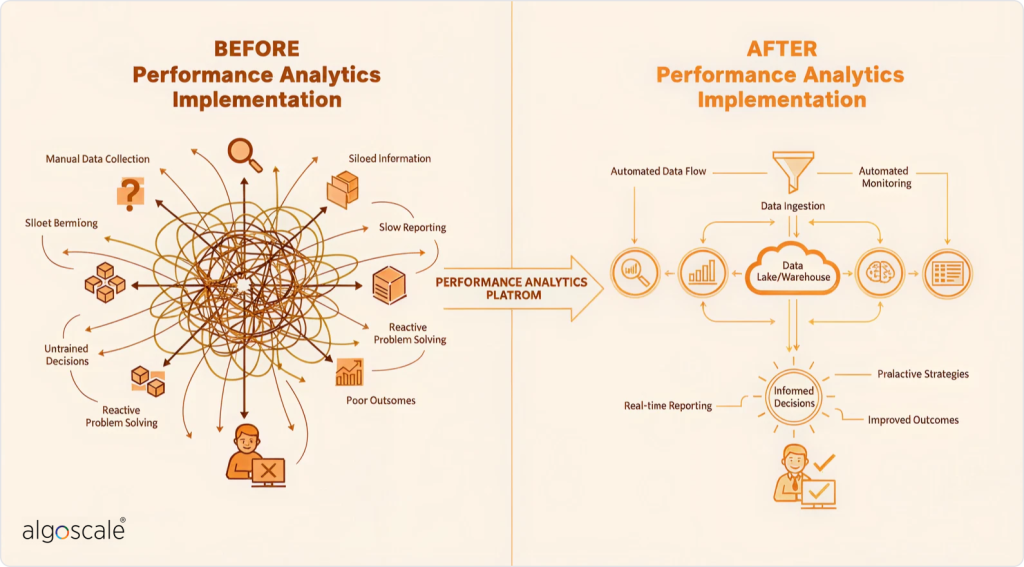
As an industry leader in end-to-end data lifecycle management and performance analytics implementation, Algoscale can help you navigate the above challenges and implement performance analytics for tangible, stronger, and faster results that align with your goals. Our team of data experts and analysts understands your long-term and short-term goals, identifies what needs to be measured to move closer to predefined objectives, and defines clear metrics that help you track meaningful progress.
Once this is clear, we integrate your data from different sources like ERP, CRM, apps, sensors, marketing tools, and web analytics into a unified data ecosystem, forming the single source of truth for analysis and progress tracking. With clean and structured data being the foundation for successful performance analytics implementation, we help businesses engineer data and get it ready for modeling, validation, and analysis.
Our experienced data engineers bring precision, efficacy, and method to this process and establish a strong and reliable foundation for data-driven decision-making. You can hire data engineers from Algoscale to assess your data’s preparedness and get it ready as an enabler for decision making. The next step is to create real-time performance dashboards and custom reports to simplify the process of measuring KPIs and tracking goals with intuitive visuals tailored to your stakeholders needs.
Once you meet your first set of goals, we review results, define new areas for improvement, identify KPIs, and implement a repeatable data-driven culture for continuous innovation. With our experienced team of data analysts, industry-rich expertise in aligning core organizational data from employee productivity, operations, and customer engagement, we help you use it as an enabler for informed decisions, strategy optimization in real-time, and agility required for long-term competitiveness. Whether you are struggling with lack of visibility into operations, or siloed data giving you a fragmented picture with no actionable insights, our performance analytics expertise has got you sorted.
Get started with your performance analytics journey with Algoscale and embrace a culture where data guides your growth journey ahead of competition!
FAQs
1. Is performance analytics for businesses of all sizes?
Yes, performance analytics is beneficial for small businesses and large enterprises alike. Small businesses benefit from understanding what drives their growth and allocating their limited resources to maximize their impact (vs spending them on initiatives that do not align with growth targets), and large enterprises use performance analytics to get a unified and holistic understanding of complex operations, measure departmental success with KPIs, and refine strategies at scale while adjusting to a challenging market.
2. How do performance management analytics work?
Performance management analytics collect comprehensive employee or department data, including goals and KPIs, analyze performance trends and benchmarks to identify gaps, and identify areas for improvement by combining HR data, productivity markers, and operational workflows. Dashboards and reports clearly indicate strengths and weaknesses, what’s working or not, and skill gaps that need to be fixed to help leaders make informed decisions.
3. What are the hidden costs while implementing performance analytics?
Hidden costs for performance analytics arise from lack of data preparedness, integrating siloed data, managing team resistance, or updating or migrating from legacy tools without industry expertise on the knowhow of end-to-end data lifecycle management. An experienced data management and analytics company can help you avoid these costs, implementing a scalable data pipeline for a repeatable performance analytics system.
4. Is performance analytics a one-time process?
It is important to understand that performance analytics is a continuous process for ongoing improvement and strategy refinement. It is the strategic necessity to transform raw data into actionable insights through regular performance assessments, establishing a data-driven culture of agility, responsiveness, and sustained long-term growth at the pace of rapidly evolving market dynamics.
5. Do I need data management services for performance analytics?
Yes, data management services help you cater to the essential pre-requisite of having clean, accurate, and consistent data, forming the foundation for accurate KPI tracking, faster reporting, and trustworthy decision-making across the business. With clean and accessible data, robust governance, and pipelines, analytics can deliver the required clarity to make decisions.
6. Can I consider Tableau consulting services as an alternative to power BI for data visualization?
Yes, since data visualization simplifies performance analytics for KPI tracking through intuitive visuals, Tableau consulting services are a smart choice to get started. Tableau offers superior visual storytelling, advanced analytics, and flexibility for complex datasets that enterprises with highly interactive dashboards and cross-platform scalability requirements can consider, going beyond the capabilities of Power BI.