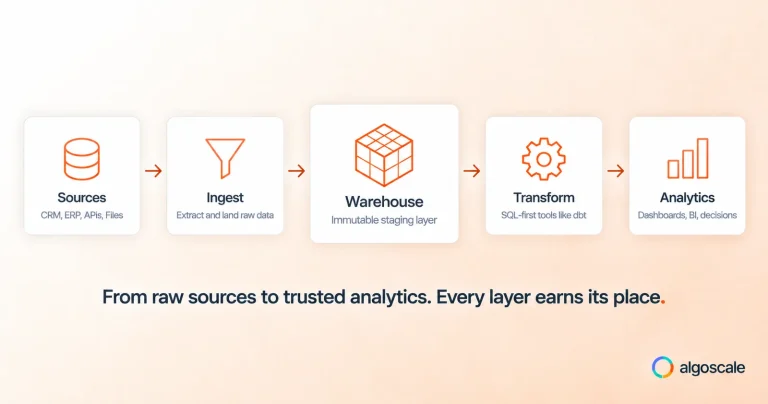


A lot of the attention in data lake projects goes into the build – storage, ingestion, table formats, governance. All of that matters, but it’s not actually the point. The point is what happens after: raw data becoming a dashboard someone actually checks, a query an analyst can run without waiting on engineering, a number a decision gets made on. A data lake that’s architecturally excellent but rarely queried hasn’t delivered its actual value yet.
This post is about that last mile – the layer of tools and practices that turns raw storage into genuinely usable insight. If you’re earlier in the process and want the architectural foundation this analytics layer sits on top of, our Data Lake Services team at Algoscale builds both the foundation and the consumption layer as part of the same engagement, since a lake that’s hard to actually use falls short of its purpose regardless of how well it’s architected underneath.
What “Data Lake Analytics” Actually Involves
Data lake analytics isn’t one tool or one step – it’s the combination of query engines, curated data structures, semantic consistency, and self-service tooling that together make raw lake data something a business user can actually work with, without needing to understand the underlying storage or write complex code. Getting this right is what separates a lake that gets used from one that becomes an expensive, well-organized archive nobody actually queries.
The Path From Raw Data to Insight
Query Engines That Make Data Lake Data Queryable
The first layer of analytics capability is simply making raw lake data queryable with SQL, without requiring every user to write custom code. Engines like Amazon Athena, Trino, Presto, and Spark SQL let analysts query data sitting directly in cloud storage, often without any data movement required. This is the foundational capability that everything else in the analytics stack builds on – without it, lake data stays accessible only to engineers comfortable writing custom processing jobs.
Curated, Analytics-Ready Views
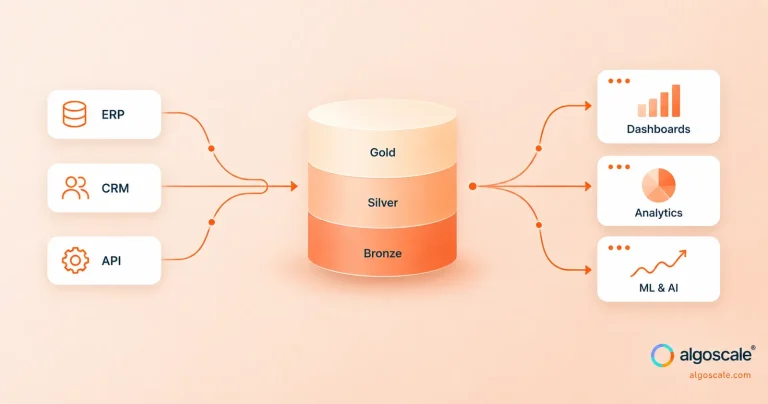
Raw and even cleaned data usually isn’t shaped the way business users actually need it – it needs to be aggregated, joined across sources, and organized around business concepts rather than raw source structure. This is the role of curated, gold-layer views or data marts: purpose-built tables designed around specific business questions, sitting on top of the more general-purpose data below. Without this layer, every analyst effectively has to rebuild the same transformations independently, which is both wasteful and a direct path to inconsistent numbers.
A Semantic Layer for Consistent Metrics
Even with curated views, a genuine risk remains: different tools or analysts calculating the same business metric slightly differently. A semantic layer defines core business metrics once – how “monthly active users” or “gross margin” is actually calculated – so every downstream tool references the same definition instead of quietly reimplementing it. This is one of the most overlooked pieces of a mature analytics stack, and its absence is a common, quiet cause of the “which number is right” problem showing up long after the underlying data architecture is otherwise solid. For a closer look at why this consistency matters organizationally, see our post on creating a single source of truth using data lakehouse architecture.
BI Tools and Dashboards
This is the most visible layer – the dashboards and reports business users actually interact with daily. Power BI, Tableau, Looker, and similar tools connect to the curated and semantic layers below to present information in a form non-technical users can actually act on. The quality of everything below this layer directly determines whether these dashboards are trustworthy or just confidently wrong.
Self-Service Analytics Enablement
Beyond pre-built dashboards, mature data lake analytics lets business users and analysts explore data themselves – running their own queries, building their own reports – without needing to file a ticket and wait on a data engineering team for every new question. This requires the curated views and semantic layer above to be genuinely accessible and well-documented, since self-service against poorly organized raw data just produces inconsistent, unreliable ad hoc analysis instead of genuine empowerment.
Advanced Analytics and ML on the Same Data
The most mature stage of data lake analytics extends beyond descriptive reporting into predictive and prescriptive analysis – machine learning models, forecasting, anomaly detection – built on the same governed data feeding BI dashboards, rather than a separate, disconnected pipeline. This is where a data lake’s flexibility genuinely pays off compared to a warehouse-only approach, since ML workloads typically need the broader, less rigidly structured data a lake can hold alongside the clean, curated data a warehouse traditionally provides. Our post on how generative AI benefits from a data lakehouse foundation goes deeper into this specific extension.
Performance Considerations for Analytics Queries
Query performance directly determines whether self-service analytics actually gets adopted – a dashboard or ad hoc query that takes minutes to return discourages exactly the exploratory behavior self-service analytics is meant to enable. Partitioning data around common query filters (typically date, and often a secondary business dimension), using columnar formats like Parquet instead of row-based formats, and maintaining reasonably sized files rather than either too many small files or a few unwieldy large ones all directly affect how responsive the analytics layer feels to actual users. These aren’t abstract technical concerns – they’re the difference between an analytics platform people actually use and one they quietly route around.
Common Analytics Adoption Mistakes
Building the lake but not investing in the consumption layer. A well-architected data lake with no curated views, no semantic layer, and no accessible query tooling delivers a fraction of its potential value, since almost nobody outside the data engineering team can actually use it directly.
Skipping the semantic layer and letting metric definitions drift. Without a shared definition layer, different teams’ dashboards quietly diverge over time, eroding trust in the platform even when the underlying data is technically accurate.
Underestimating query performance’s effect on adoption. Slow, unoptimized queries don’t just annoy users – they actively discourage the self-service behavior that makes an analytics investment pay off, pushing people back toward spreadsheets and manual exports.
Treating self-service as a tooling problem rather than an enablement problem. Handing business users query access without curated views, documentation, or basic training tends to produce as much confusion as empowerment.
For a broader look at the business impact of getting this consumption layer right, our post on top business benefits of implementing a data lake strategy covers what this looks like in outcome terms.
A Simple Analytics Maturity Model
Most organizations progress through recognizable stages. Descriptive analytics – what happened – is the starting point, typically dashboards and scheduled reports summarizing past activity. Diagnostic analytics – why it happened – adds the ability to drill into descriptive results and investigate causes, usually enabled by more flexible self-service querying. Predictive analytics – what’s likely to happen – introduces forecasting and modeling built on the same underlying data. Prescriptive analytics – what should be done about it – is the most mature stage, where models don’t just predict outcomes but actively recommend or automate decisions. Most organizations don’t need to reach the most advanced stage to get real value; knowing which stage you’re actually targeting helps scope the analytics layer appropriately rather than over-building for maturity you don’t yet need.
Making Sure Your Data Lake Actually Gets Used
An architecturally sound data lake that nobody outside the data team can query hasn’t delivered on its purpose yet – the analytics and consumption layer is where the actual return on a data lake investment gets realized. At Algoscale, our Data Lake Services team builds this layer deliberately as part of every engagement, rather than treating it as an afterthought once the underlying infrastructure is complete.
To see the broader range of data engineering and analytics work we do beyond the analytics layer specifically, take a look at what Algoscale builds across the data stack.
Why Algoscale
A few things shape how we actually deliver on data lake and data engineering work, beyond the architecture and practices covered above:
● Pre-built accelerators. We don’t start every engagement from a blank slate – proprietary accelerators built from prior implementations speed up common data source integration and analytics patterns.
● Faster time to value. For a focused initial scope covering core data sources and first analytics use cases, our accelerators typically compress development timelines to around four weeks, rather than the several months a from-scratch build often takes.
● Built on a scalable framework. Our implementation approach follows a repeatable, scale-ready framework, so the architecture built for your first use case extends cleanly as data volume and teams grow, rather than requiring a redo.
● Microsoft Solution Partner for Data & AI. Algoscale holds Microsoft Solution Partner status for Data & AI, including specific expertise implementing Microsoft Fabric as a modern data warehouse.
Frequently Asked Questions
1. Do we need all six layers of the analytics stack from day one?
No. A reasonable starting point covers query engines and a handful of curated views for your highest-priority use cases, with the semantic layer, broader self-service, and advanced analytics added as real usage patterns and needs emerge.
2. What’s the most commonly skipped layer that causes problems later?
The semantic layer. Teams often build curated views and connect BI tools without formally defining shared metric calculations, which works fine until multiple dashboards built independently start showing slightly different numbers for what should be the same metric.
3. How do we know if query performance is actually hurting adoption?
Watch for indirect signals – business users falling back to manual spreadsheet exports, requests for the same report repeatedly rather than self-service exploration, or direct feedback that dashboards feel slow. These usually indicate a performance problem discouraging the behavior self-service analytics is meant to enable.
4. Can we run BI and machine learning workloads from the same data lake without conflict?
Yes, and this is one of the specific advantages of a well-architected data lake – both can draw from the same governed data, with appropriate compute isolation so heavy ML processing doesn’t degrade BI query performance for other users.
5. Do business users need to learn SQL for self-service analytics to work?
Not necessarily. Many BI tools offer no-code or low-code interfaces on top of the curated and semantic layers, letting business users explore data without writing SQL directly, as long as those underlying layers are well-structured and documented.
6. How do we decide which analytics maturity stage to target first?
Start with what’s actually blocking a specific business decision today. Most organizations get substantial value from solid descriptive and diagnostic analytics before predictive or prescriptive capabilities become the priority, and building that foundation well makes the more advanced stages easier when you’re ready for them.