


Key insights
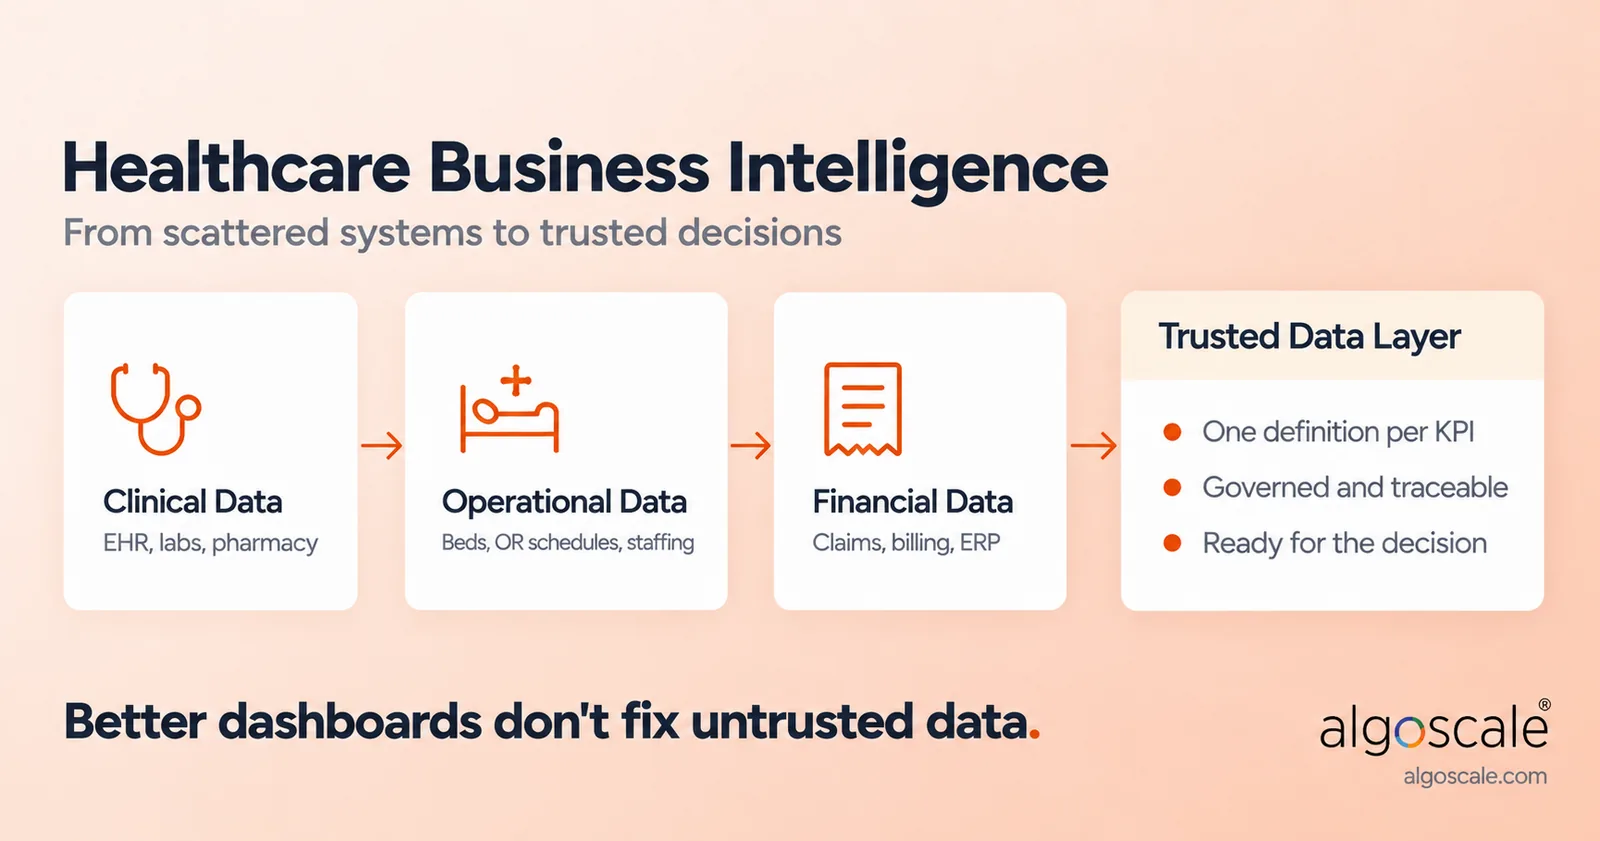
- Healthcare business intelligence integrates clinical, operational and financial data into consistent definitions, so hospitals, health systems and payers make decisions on one trusted version of the numbers.
- Most healthcare BI problems are definition and governance problems, not visualization problems: KPIs such as length of stay, readmission rate and claim denial rate are often calculated differently across departments.
- The most valuable healthcare BI is operational: it supports decisions during the shift on bed flow, discharge blockers, OR capacity and denial patterns, not just monthly reporting.
- A healthcare BI architecture has to solve five problems before tools are chosen: ingestion, identity and standardization, data quality, governance and consumption.
- For US payers, the CMS Interoperability and Prior Authorization Final Rule makes FHIR-based APIs a major requirement from January 1, 2027, changing how claims, member and authorization data are analyzed.
- In Algoscale’s healthcare work, an Azure lakehouse unified more than four systems in about 20 weeks, and healthcare supply chain analytics surfaced $4.5 million in identified cost-saving opportunities.
A hospital can have 200 dashboards and still struggle to answer a basic question:
What’s stopping us from discharging this patient today?
The bed management system can display occupancy, the EHR holds the clinical record, staffing information is stored elsewhere, social care information might exist completely outside the hospital, finance has its own data, and there are other views provided by OR schedules, referrals, claims, the pharmacy and the laboratory systems.
Each system can be technically correct. The organization can still be operating on different versions of reality.
That is the problem healthcare business intelligence needs to solve.
What is healthcare business intelligence? Healthcare business intelligence (BI) is the practice of integrating clinical, operational and financial data from systems such as EHRs, claims, revenue cycle, ERP and lab platforms, modeling it into consistent definitions, and delivering it as reports, dashboards and alerts that hospitals, health systems and payers use to make decisions. It is the foundation behind any serious healthcare BI services engagement.
For many years healthcare business intelligence was mainly seen as a reporting activity. Data was extracted from the operational systems, placed into a warehouse, dashboards were created and senior management was given a clearer picture of performance. That model is becoming inadequate.
Hospitals, health systems and payers increasingly need analytics that link up scattered data, reconcile different definitions, maintain the relevant clinical and regulatory controls and make information available quickly enough to change an operational decision.
At times it involves a choice about a bed. At other times it means identifying a claims pattern before it turns into a financial issue. At other times it consists of working out why an operating room has capacity even though patients are still on the waiting list.
The question has moved from “How do we report on our healthcare data?” to “How do we create a trusted data layer that the organization can actually base its operations on?”
The Four Types of Healthcare Business Intelligence
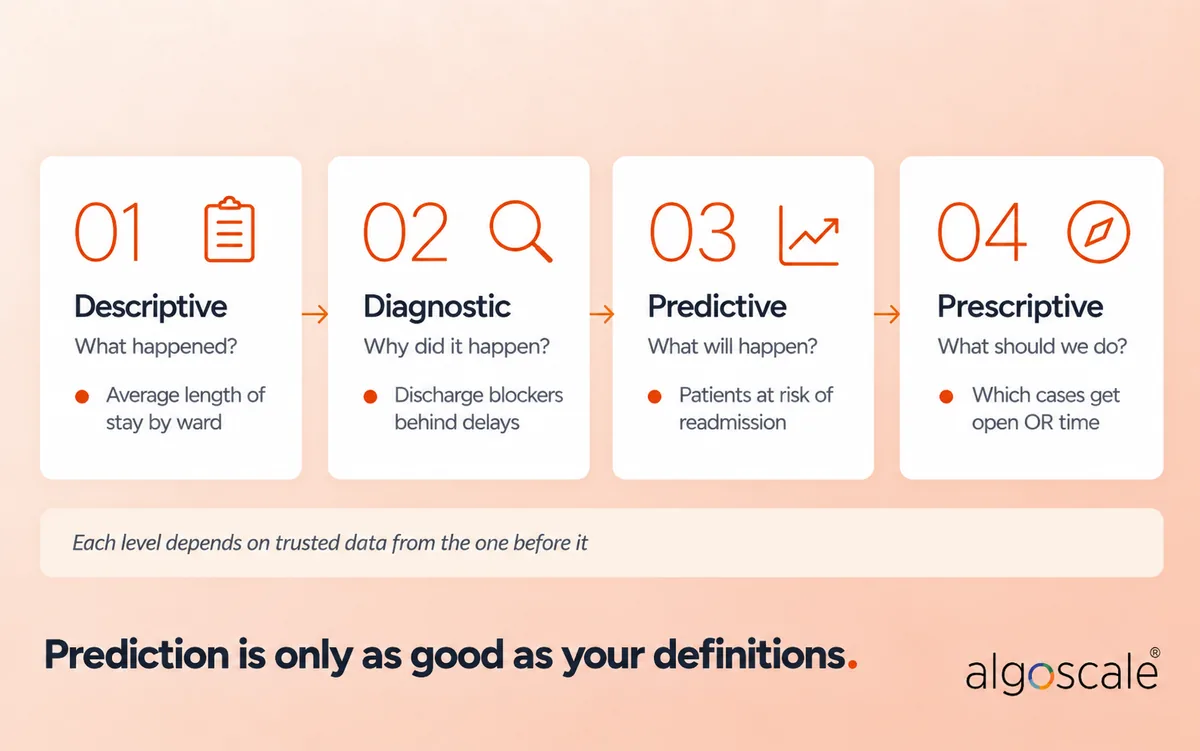
Most healthcare BI programs mature through four types of analytics. Each one answers a harder question, and each one depends on the data foundation underneath the one before it.
| Type | Question it answers | Healthcare example |
| Descriptive | What happened? | Average length of stay by ward last month |
| Diagnostic | Why did it happen? | Which discharge blockers drove the increase in delayed days |
| Predictive | What is likely to happen? | Which admitted patients are at high risk of a 30-day readmission |
| Prescriptive | What should we do next? | Which elective cases to prioritize when OR capacity opens up |
Most organizations don’t stall at predictive analytics because of the models. They stall because the descriptive layer underneath still contains conflicting definitions.
Business Intelligence in Healthcare Starts Before the Dashboard
A healthcare analytics dashboard is only as reliable as everything underneath it.
Consider something as familiar as “length of stay.” It sounds like one metric. In practice, its definition can vary by facility, clinical team, episode type, inclusion criteria and reporting purpose. Now combine that metric with bed occupancy, discharge readiness, staffing levels and downstream care availability.
The visualization isn’t the difficult part.
The difficult part is establishing which source owns each field, how records are matched, when data becomes available, which transformations have occurred, who can see it and whether two departments calculate the same KPI the same way.
This is why modern business intelligence in healthcare sits across several layers: source systems, ingestion, storage, transformation, data quality, governance, semantic models, analytics and operational action.
Break one layer and the dashboard may still load. That’s dangerous. It can create confidence in information that isn’t actually trustworthy.
The “Single Source of Truth” Is Usually a Modeling Problem
It is common for healthcare organizations to say that they want a single source of truth, but that doesn’t mean that all the information has to be put into one database.
A better aim would be to arrive at a consistent interpretation of distributed data.
Look at the information relating to patients. A single individual might look different in an EHR, a CRM, a billing platform, the claims environment and an external dataset. The same problems occur with regard to provider names and facility identifiers. Product and supplier data can also be just as inconsistent in healthcare procurement.
If the problems with those entities are not dealt with properly, then putting them into a lakehouse will merely result in a centralized form of the same issue.
Master data management, standardized identifiers, validation rules, metadata and clearly governed semantic definitions are all necessary for healthcare BI. Otherwise, the idea of a “single source of truth” remains empty.
The Most Valuable Healthcare BI Is Moving Closer to the Decision
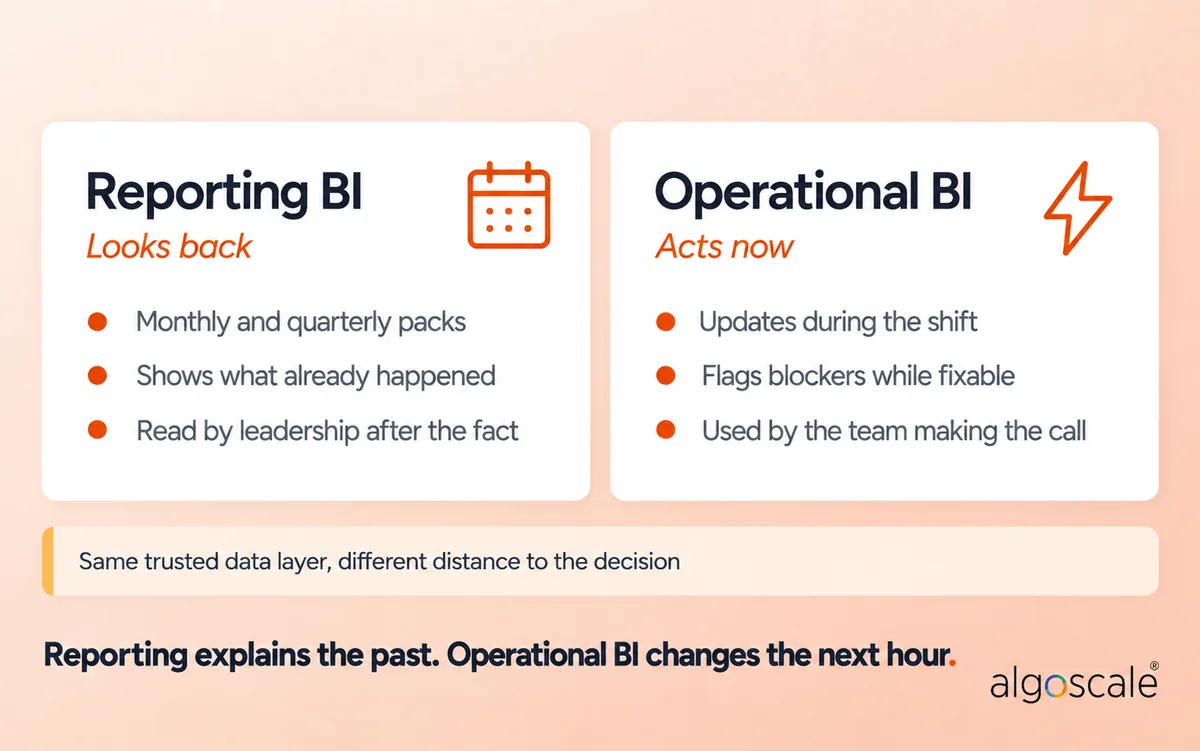
Monthly reporting isn’t disappearing. But the more interesting use of healthcare BI solutions is happening much closer to operational decisions.
NHS England offers a useful real-world example. Its Federated Data Platform connects information held across separate systems and uses that data for operational applications including elective recovery, waiting-list management and patient discharge.
By the end of March 2026, NHS England reported that trusts using its Inpatient Care Coordination Solution had enabled 111,589 additional patients to undergo procedures compared with the period before FDP use. The same platform had supported reviews leading to 87,842 inpatient waiting-list removal requests for patients who no longer needed to remain on those lists.
That’s BI doing something.
Not reporting how many procedures happened last quarter, but helping operational teams identify unused theatre capacity, prioritize patients and act on waiting-list information.
The discharge use case is even more instructive. OPTICA integrates electronic patient records with local health and social care data so teams can see where a patient sits in the discharge pathway and identify blockers. NHS England reports 348,084 patients had been discharged with support from the system by March 2026.
The outcome numbers deserve a caveat, though. NHS England measures benefits by comparing each trust’s performance before and after adoption, while an independent Health Foundation analysis compared adopting trusts with non-adopting ones and found no meaningful difference in delayed discharges. That gap is itself a BI lesson: the same data can tell two different stories depending on how the baseline is defined.
Reporting tells you what happened. Operational BI helps determine what should happen next.
BI for Hospitals: Five Decisions the Data Architecture Needs to Support
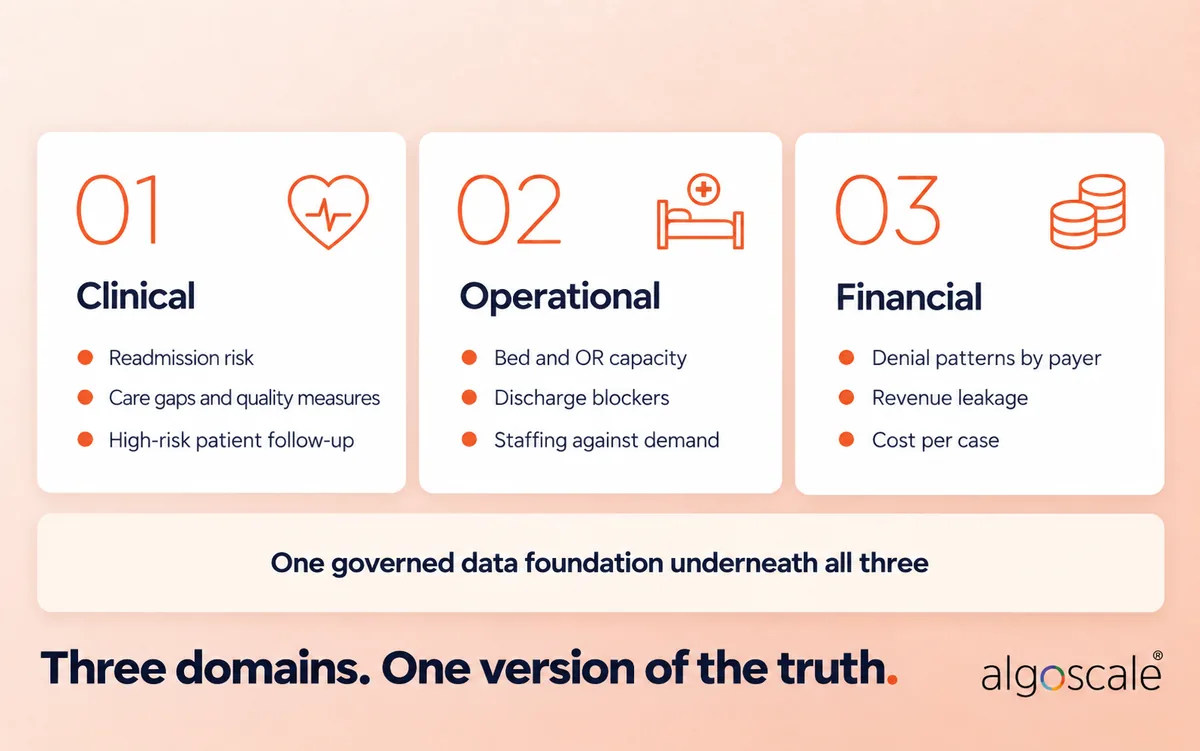
Healthcare BI decisions fall into three domains: clinical, operational and financial. A hospital’s data architecture has to support all three from the same governed foundation.
Where Is Capacity Being Lost?
Bed occupancy alone doesn’t explain hospital flow. You need to understand admissions, expected discharge dates, clinical readiness, outstanding tasks, OR utilization, staffing and downstream capacity together.
The same principle applies to operating rooms. A utilization percentage tells leadership something happened. Connecting schedules, cancellations, staffing, patient readiness and OR availability can help teams understand why capacity is being lost.
Where Is Revenue Leakage Occurring?
Revenue cycle analytics shouldn’t stop at a dashboard showing denials.
Healthcare organizations need to trace denial patterns back through payer, procedure, documentation, coding and workflow data. That changes the question from “What’s our denial rate?” to “Which combinations of payer, procedure and workflow are creating avoidable denials?” The second question can drive action.
Where Is Patient Flow Breaking Down?
Length of stay is an outcome. The operational value comes from understanding the events producing it.
A useful healthcare analytics dashboard might therefore combine discharge readiness, pending diagnostics, pharmacy status, transportation, social care dependencies and other blockers rather than simply displaying average LOS. That’s what turns a KPI into operational intelligence.
Where Is Clinical Risk Building Up?
Clinical BI starts with the same integration problem. Readmission risk, care gaps and quality measures all depend on combining EHR, lab, pharmacy and claims history for the same patient.
The useful question isn’t “What is our readmission rate?” It is “Which patients discharged this week look like the ones who came back last quarter, and has anyone followed up?” That is where healthcare data analytics and BI meet: a model may flag the risk, but the BI layer has to put it in front of the care team in time.
Can Leadership Trust the Number?
If finance reports one figure, operations reports another and a board dashboard shows a third, the organization doesn’t primarily have a visualization problem. It has a governance problem.
Healthcare BI architecture needs traceable metric definitions, lineage, data quality monitoring and ownership so executives don’t spend meetings debating which number is correct.
Healthcare KPIs That Need One Definition Before They Need a Dashboard
Most healthcare KPIs look simple until two departments calculate them. The table below shows common hospital and revenue cycle KPIs, the systems they draw from and where definitions usually drift.
| KPI | Typical formula | Source systems | Where definitions usually conflict |
| Average length of stay | Total inpatient days / discharges | EHR, ADT | Observation stays, same-day cases, transfers counted as new episodes |
| Bed occupancy rate | Occupied beds / staffed beds x 100 | ADT, bed management | Licensed vs staffed beds, midnight census vs real-time |
| 30-day readmission rate | Readmissions within 30 days / index discharges | EHR, claims | All-cause vs unplanned, same facility vs any facility |
| OR utilization | Used OR minutes / allocated block minutes | OR scheduling, EHR | Whether turnover time counts, scheduled vs staffed hours |
| Claim denial rate | Denied claims / submitted claims | Claims, revenue cycle | By count vs by dollar value, initial vs final denials |
| Days in A/R | Total A/R / average daily net revenue | Billing, ERP | Gross vs net revenue, averaging window |
| Cost per case | Total cost / cases, case-mix adjusted | ERP, costing, EHR | Direct vs fully loaded cost, which case-mix index |
Every row in that last column is a meeting someone has already sat through. Agreeing on one definition, one owner and one source before building the dashboard is what keeps the number trusted later.
Three Healthcare Dashboard Examples Worth Building
Bed flow and discharge blockers. Shows every patient with an expected discharge date, the open tasks blocking it and who owns each task. It answers “What’s stopping this discharge today?” rather than “What was our occupancy?”
Denials root cause. Breaks denials down by payer, procedure, denial reason and workflow step, so revenue cycle teams can fix the pattern instead of reworking individual claims.
Readmission follow-up worklist. Lists recently discharged high-risk patients with their follow-up status. It turns a quality metric into a daily task list for care coordinators.
BI for Payers Is About to Become More API-Driven
The payer side has another pressure: interoperability. CMS’s Interoperability and Prior Authorization Final Rule requires impacted payers to implement several API capabilities, with major API requirements generally taking effect January 1, 2027. These include Provider Access, Payer-to-Payer and Prior Authorization APIs, built around HL7 FHIR standards.
That shouldn’t be viewed only as a compliance project. More standardized exchange creates opportunities to connect claims and encounter data with prior authorization, member and provider information. But an API doesn’t automatically create useful analytics.
Someone still needs to reconcile the incoming data with internal models, establish quality rules, map historical claims, member and authorization data to new FHIR resources, and decide which operational metrics become useful once those connections exist.
That’s where BI for payers intersects with modern data engineering.
A Healthcare BI Architecture Has to Solve Five Problems
Forget the tool logos for a moment. A healthcare BI platform has five harder jobs.
Ingestion. Can it reliably ingest data from EHRs, claims systems, ERP platforms, labs, CRM applications, APIs and external partners without building a fragile custom pipeline for every source? This is where most data integration effort goes.
Identity and standardization. Can records referring to the same patient, provider, organization, supplier or service be reconciled?
Quality. Can teams identify missing, duplicated, late or anomalous data before it reaches an executive or clinical dashboard?
Governance. Can the organization see where a metric originated, which transformations were applied and who is allowed to access the underlying information?
Consumption. Can the same governed data serve executive BI, operational dashboards, self-service analytics and eventually predictive or AI-driven use cases? An AI application can’t reason reliably over patient, claims or operational data that still contains unresolved duplicates, inconsistent definitions and missing lineage. BI exposes those weaknesses early, and that’s useful.
Choosing a technology before understanding these five requirements gets the sequence backwards.
Healthcare BI Tools: Choose by Layer, Not by Logo
Azure, AWS, Databricks, Snowflake and Microsoft Fabric can all support different parts of this stack. Power BI and Tableau can both be appropriate consumption layers. The better comparison is by layer:
| Layer | Common options | What to check in a healthcare setting |
| Ingestion and integration | Azure Data Factory, AWS Glue, Fivetran | HL7 and FHIR support, API connectors for EHR and claims, PHI handling in transit |
| Storage and processing | Snowflake, Databricks, Microsoft Fabric, Azure Synapse | Whether the vendor signs a HIPAA business associate agreement, row and column security, cost at your data volume |
| Modeling and governance | Fabric and Power BI semantic models, Unity Catalog, Microsoft Purview | Lineage, certified metric definitions, ownership per KPI |
| Consumption | Power BI, Tableau | Row-level security, embedded use, self-service for clinical users |
The tool decision matters less than whether the data warehouse or lakehouse underneath gives every one of these layers the same definitions. For a deeper look at the consumption layer, see what Power BI consulting covers in 2026.
What This Looks Like in a Real Healthcare Data Environment
Take the case of an Ontario-based health professional regulatory organization working with Thentia, Sage Intacct, Qualtrics and some other systems.
The issue wasn’t that they needed Power BI. The data was spread out among various applications, and there were concerns regarding data quality and integration. There was no single analytical view, and any future architecture would have to include governance compliant with PHIPA requirements.
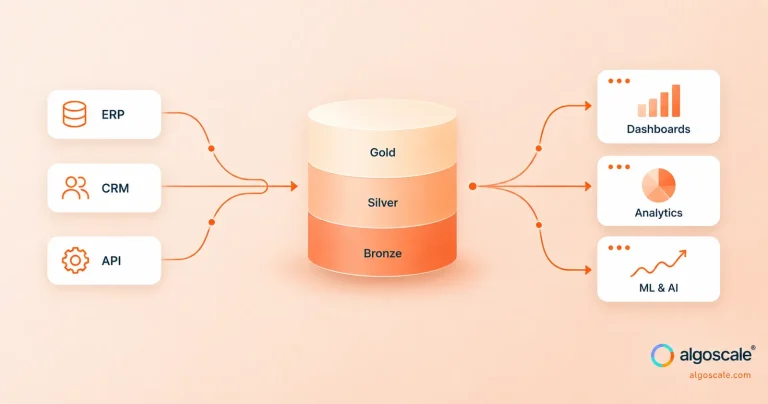
Algoscale designed a lakehouse based on Azure, using Bronze, Silver and Gold layers. Azure Data Factory was in charge of ingesting the APIs and files, while Synapse and Fabric carried out the transformations. Above the data there was a Power BI semantic layer, which included role-based and column-level controls.
More than four systems were brought together, the platform was delivered within about 20 weeks and a three-year data roadmap was set up at the same time.
Another useful example comes from healthcare procurement.
A healthcare supply chain automation company serving more than 1,900 healthcare facilities across 35+ countries had only limited insight into spending amounting to about $8 billion, because its systems were disconnected and product naming was inconsistent, which led to duplication.
Algoscale integrated its ERP system with vendor data, standardized product information across millions of records, and developed real-time analytics for spending and supplier performance.
The documented results were $4.5 million in identified cost-saving opportunities, roughly a 10x return on investment, and decisions being made 50% faster.
That is why healthcare BI should not be limited to clinical analytics; data from procurement, supply chain, finance and operations can generate just as much business value.
Where Healthcare BI Projects Usually Go Wrong
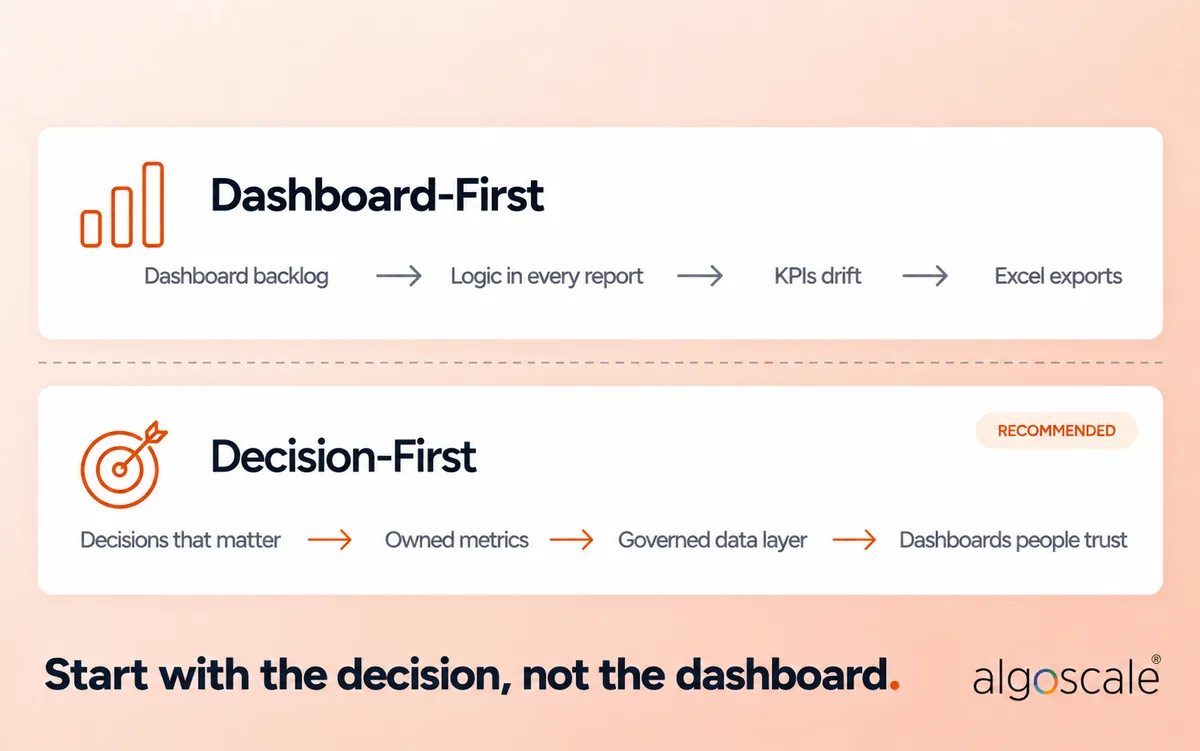
One mistake appears repeatedly: starting with the dashboard backlog.
“Finance needs six dashboards.” “Operations needs twelve.” “The board wants a scorecard.”
So teams begin building.
Six months later, every dashboard contains its own transformation logic. KPI definitions drift. Analysts maintain parallel SQL queries. Business users export everything into Excel because they still don’t trust the numbers.
The organization has technically implemented BI while making its data estate harder to govern.
A stronger healthcare BI consulting engagement asks different questions first.
Which decisions matter? Which metrics inform them? Who owns those metrics? Which source systems produce the underlying data? What latency is actually required? What data quality threshold is acceptable? Which users need access? What needs to be auditable?
Then build.
Build Healthcare BI Around Decisions, Not Dashboards
The strongest healthcare BI solutions won’t necessarily have the largest number of dashboards. They’ll reduce the distance between an event and a decision.
A cancellation becomes visible before OR capacity is wasted. A discharge blocker appears while someone can still resolve it. A claims pattern is identified before it becomes a larger revenue problem. A supply-chain anomaly appears before it affects availability. And leadership stops arguing over which report contains the correct number.
Once healthcare business intelligence becomes trusted enough to influence daily operations, it stops being a reporting system. It becomes part of the operating system of the organization.
Algoscale helps healthcare organizations build and modernize the data foundations behind analytics, from ingestion and lakehouse architecture to governance, semantic modeling and enterprise BI.
Not sure where your foundation stands? Score your data maturity in about four minutes, or talk to Algoscale about your healthcare BI environment.
Frequently Asked Questions
How can healthcare business intelligence integrate data from EHR, claims, and financial systems?
Healthcare business intelligence (BI) can pull together information from EHRs, claims, revenue cycles, ERPs, CRMs, laboratories, pharmacies, and other vital sources using APIs, direct database connections, and automated ingestion pipelines. Once gathered, this data can be standardized and modeled within a centralized warehouse or lakehouse. This allows teams to analyze information across various systems seamlessly, eliminating the need to manually stitch together fragmented reports or spreadsheets.
What are the best healthcare BI tools for hospitals and health systems?
The ideal healthcare BI solution depends on several factors, including an organization’s data architecture, reporting needs, security models, existing technology stack, and specific analytical goals. Platforms like Microsoft Power BI, Tableau, Microsoft Fabric, Snowflake, Databricks, Azure, and AWS can each support different aspects of a healthcare analytics environment. The key is to compare them layer by layer and focus on how they work together to create governed, reliable data, rather than simply picking a visualization tool in isolation.
How do healthcare analytics dashboards support hospital operational decision-making?
Healthcare analytics dashboards consolidate critical metrics, such as bed capacity, admissions, discharge status, length of stay, operating room utilization, staffing, and patient flow, into a single view. Instead of wading through separate reports from different departments, hospital leaders can use a shared analytical perspective to quickly spot capacity constraints, operational bottlenecks, and other areas that need immediate attention.
How does healthcare BI help payers analyze claims and member data?
Healthcare BI allows payers to merge claims, member, provider, utilization, authorization, and encounter data to better understand costs, utilization patterns, provider performance, and operational trends. By using a governed data model, it also becomes much easier to connect new interoperability data with historical claims and internal datasets, leading to more consistent and accurate payer analytics.
What does it take to build a HIPAA-compliant healthcare BI environment?
For organizations handling protected health information (PHI), building a BI environment requires strict security and governance controls throughout the entire data pipeline, in line with the HIPAA Security Rule. Depending on the specific use case, this may involve role-based access, column-level or row-level security, encryption, audit trails, data lineage, controlled data movement, and rigorous access policies. It is essential to address these compliance requirements during the initial architecture and data modeling phases, rather than trying to “bolt them on” after dashboards are already built.
How can healthcare organizations modernize legacy BI reporting without disrupting existing operations?
Healthcare organizations can modernize their legacy BI systems through an incremental approach. This involves identifying high-value reporting workloads, mapping their underlying data sources, establishing a modern data layer, and migrating priority dashboards in phases. Because existing reports can continue to run during the transition while new pipelines and semantic models are being validated, organizations can avoid the risks associated with a disruptive “big bang” migration.
How much does healthcare BI implementation cost?
The cost of implementing healthcare BI varies widely based on several factors: the number and complexity of source systems, data volume, integration needs, governance requirements, the scope of the dashboards, cloud architecture, and the extent of modernization required. For example, a BI environment built around a few standardized sources will have a vastly different price point than an enterprise-wide program involving multiple EHRs, claims platforms, legacy databases, and external data sources. For a quick range based on your own scope, estimate your engagement.
How can healthcare organizations measure ROI from business intelligence?
Measuring the ROI of healthcare BI is most effective when you connect analytics to measurable operational or financial outcomes, rather than just counting the number of dashboards produced. Depending on the goals, organizations can track improvements such as reduced manual reporting efforts, faster decision-making cycles, better resource utilization, decreased revenue leakage, lower operational costs, improved patient flow, or enhanced visibility into clinical and financial performance. To accurately measure these changes, it is vital to establish a clear baseline before the implementation begins.