


Key Insights for Data Strategy Leaders
- Licensing Divergence: Power BI Pro costs $14/month per user ($168/year). Tableau Creator is $75/month ($900/year), and read-only Viewers cost $15/month ($180/year).
- Viewers Drive the Bill: A 50-person Tableau team (5 Creators, 15 Explorers, 30 Viewers) costs $17,460 a year, against $8,400 on Power BI Pro. Past a few hundred viewers, a Fabric F64 capacity removes viewer licences entirely.
- Engine Demands: Power BI’s VertiPaq engine needs star schemas to perform well. Tableau’s VizQL engine works much better on wide, denormalised tables.
- Data Prep Bottlenecks: Most reporting issues are data issues. Power BI includes Power Query out of the box, whereas Tableau generally requires dedicated prep tools or pre-built SQL views.
- AI Sits Behind Premium Plans: Copilot in Power BI only runs on a paid Fabric capacity (F2 or higher). Tableau Agent sits in the higher-priced Tableau+ edition.
- Migration Is a Rebuild: There is no automatic Tableau-to-Power BI converter. LOD expressions get rewritten in DAX, and the data layer usually needs remodelling first.
- Enterprise Gravity: Power BI dominates corporate adoption because it connects directly into Microsoft Entra ID and the Microsoft 365 ecosystem.
- Development Access: Power BI Desktop is 100% free for private local development, but runs only on Windows. Tableau Public is free but exposes workbooks to the public internet, and Tableau Desktop Free Edition works locally but can’t share. Tableau runs natively on Mac.
Every few months, another client asks us to referee an internal war over power BI vs tableau. It’s almost always sparked by the same thing: someone in marketing saw an interactive scatter plot at a conference, while the head of finance refused to sign off on a software quote that looked like a telephone number.
Most of these comparisons miss the point. They compare user interfaces. They argue over colour palettes, typography, and whether tooltip animations look smooth. None of that matters when you are three months into a deployment.
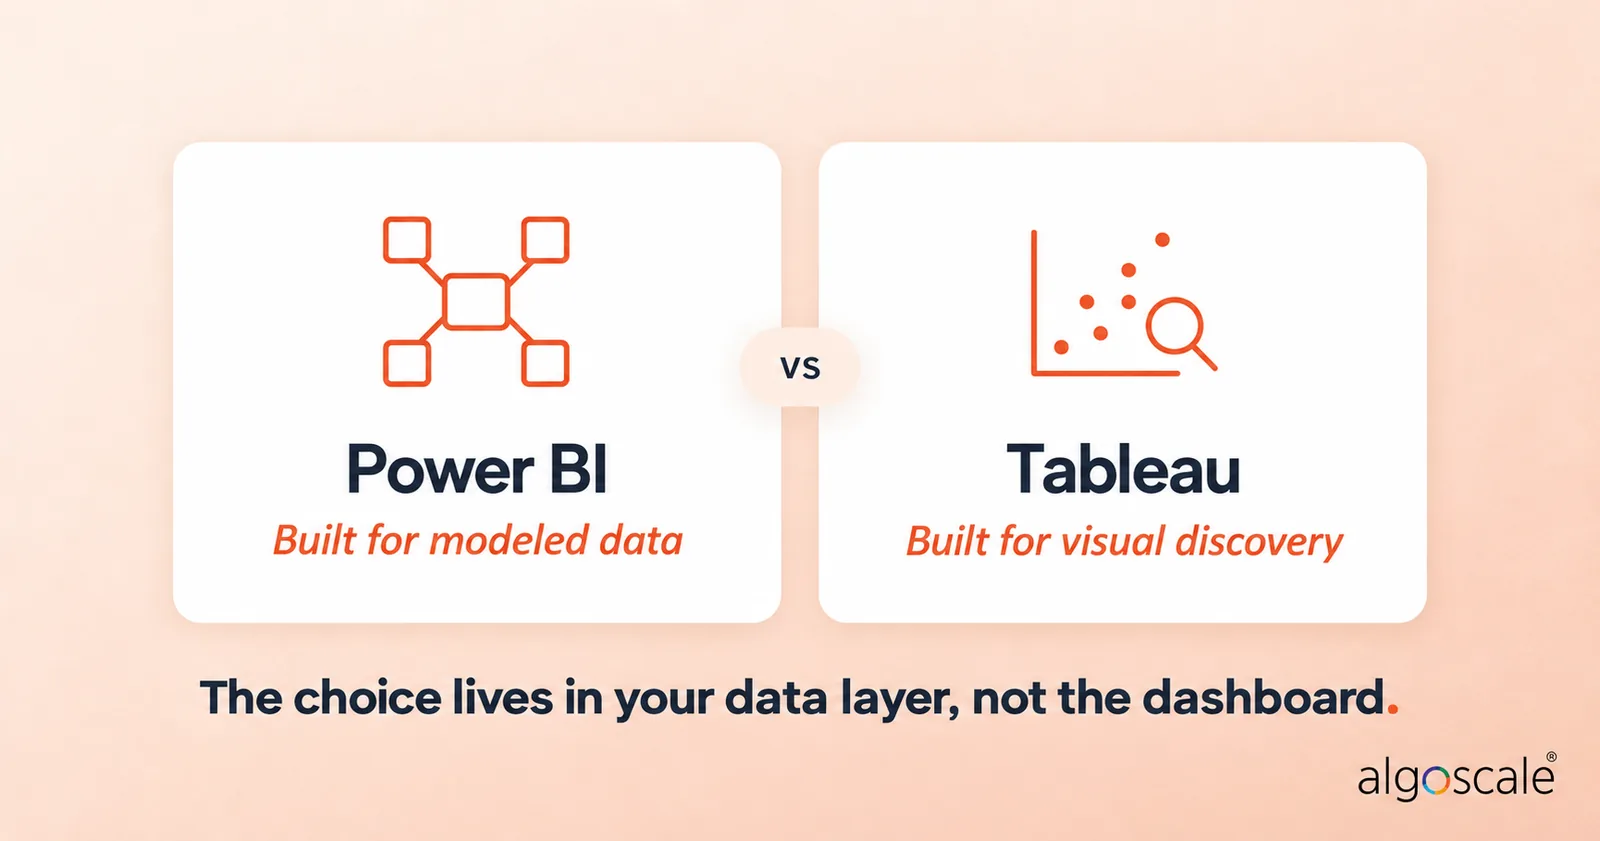
The genuine difference between tableau and power BI isn’t visual. It sits in your database layer. It is about how your tables are structured right now, what talent you can realistically hire, and how much you’re willing to pay per head just so casual employees can glance at monthly numbers.
If you are caught between tableau or power BI in 2026, forget the vendor sales demos. Here is what happens when both tools hit production data.
Under the Hood: VertiPaq vs VizQL
Don’t buy a single seat until you know how these two process queries. Their core engines have completely opposite design philosophies.
Tableau runs on VizQL. Think of it as an automated translator. You drag an attribute onto a shelf, and VizQL converts that movement into an optimised SQL query, fires it at the database, and renders the result. For extracts, Tableau also uses Hyper, its own in-memory engine, so large datasets don’t always have to hit the source database live.
If your company relies on wide, flat, denormalised tables, say, huge tables with seventy attributes jammed together, Tableau feels brilliant. Analysts can slice and dice on a whim, stumble into unexpected trends, and build views without touching a data model first. It was built for visual data discovery, and it still does that better than almost anything else.
Power BI takes the opposite approach. It relies on VertiPaq, an in-memory columnar database. When people ask us, “is power BI better than tableau?”, our first question is always: “What does your data schema look like?”
VertiPaq hates flat, messy extracts. Dump a sprawling 100-column flat table into it, and memory bloats while DAX gets much harder to write correctly. Power BI demands strict dimensional modelling: star schemas, lean fact tables, dimension tables, and clean one-to-many relationships.
Build those schemas and write tidy DAX measures, and VertiPaq runs circles around traditional databases. It crushes gigabytes of raw data down into RAM and returns answers in milliseconds. But if your team expects to drag uncleaned tables onto a canvas without modelling them first, you will hate using it.
The Data Prep Challenges
Building a power BI vs tableau dashboard is relatively fast. Getting the numbers clean enough to visualise is where budgets quietly bleed out.
Tableau is a visual powerhouse, but it is not an ETL pipeline. If your source data is spread across different platforms with mismatched timestamps and missing customer codes, Tableau expects you to fix that upstream. You either write raw SQL views, set up dbt models, or pay extra for Tableau Prep licences.
According to our experiences with projects, this hidden labour is where analytics budgets secretly double. We have seen this repeatedly across mid-market retailers. One firm running operations across 25 locations had a Tableau licence bill that looked cheap on paper.
Yet their analysts were spending a large share of their working week in Excel, manually stitching CSV exports together so Tableau wouldn’t crash. The software was inexpensive; the engineering payroll thrown at data prep was staggering.
Power BI handles this differently. It embeds Power Query directly into the desktop client. You get a visual data transformation engine right out of the box. You can merge tables, unpivot columns, and fix types without buying extra pipeline software.
It won’t cure a fundamentally broken data lake, but it saves smaller teams months of manual spreadsheet gymnastics.
Power BI vs Tableau Pricing: 2026 Rates
Let’s cut through the vague estimates and look at the actual invoices Microsoft and Salesforce issue in 2026.
Tableau locks you into three distinct subscription tiers, billed annually:
- Tableau Creator: $75 per user/month ($900 billed annually). Mandatory for anyone creating data models or publishing workbooks. You must buy at least one.
- Tableau Explorer: $42 per user/month ($504 billed annually). For power users who tweak existing dashboards or build ad-hoc views in a browser.
- Tableau Viewer: $15 per user/month ($180 billed annually). Strictly read-only access for viewing dashboards, filtering, and exporting.
These are Tableau Cloud Standard prices. Enterprise edition, which adds governance and data management features, runs $115, $70, and $35 for the same three roles.
Power BI’s per-seat pricing is far more direct:
- Power BI Pro: $14 per user/month ($168 billed annually). Complete authoring, publishing, and sharing rights.
- Power BI Premium Per User (PPU): ~$24 per user/month. Expands dataset limits up to 100 GB and adds deployment pipelines.
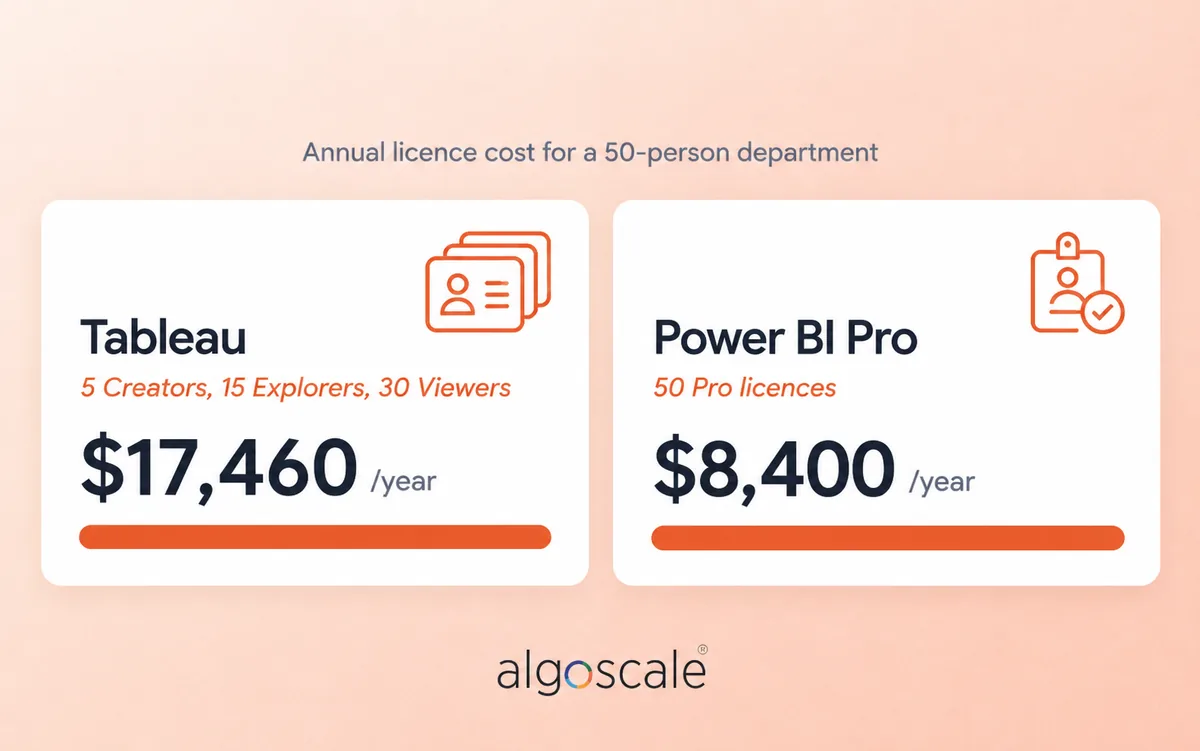
Now look at the real-world gap when calculating power BI vs tableau cost for a standard 50-person department. A typical Tableau rollout might look like: 5 Creators, 15 Explorers, and 30 Viewers. That annual software bill comes to $17,460.
Equip those exact same 50 employees with full Power BI Pro licences, and the total comes to $8,400 a year. That is an extra $9,060 leaving your bank account every twelve months just for the right to open dashboards.
When comparing power BI vs tableau pricing, licence sprawl hits Tableau deployments hardest. A project starts with two Creators ($1,800). Then regional managers ask for access, operational staff request Explorer accounts, and within eighteen months the renewal bill tops $10,000.
The maths shifts again at scale. Past a few hundred viewers, a Microsoft Fabric F64 capacity can work out cheaper than per-seat Pro licences, because viewers on F64 or higher no longer need a paid licence to open reports.
If you choose to run Tableau Server on your own infrastructure instead of using Tableau Cloud, factor in another $15,000 to $30,000 annually for virtual machines, storage volumes, monitoring tools, and dedicated sysadmin hours.
Overhauling a Security Integrator’s Warehouse
Because of that cost gap, requests for a tableau to power BI migration land on our desks regularly.
Migrating platforms is not an automated conversion exercise. If you simply copy workbooks visual-for-visual, you inherit sluggish, brittle dashboards because the two calculation engines operate on opposing logic.
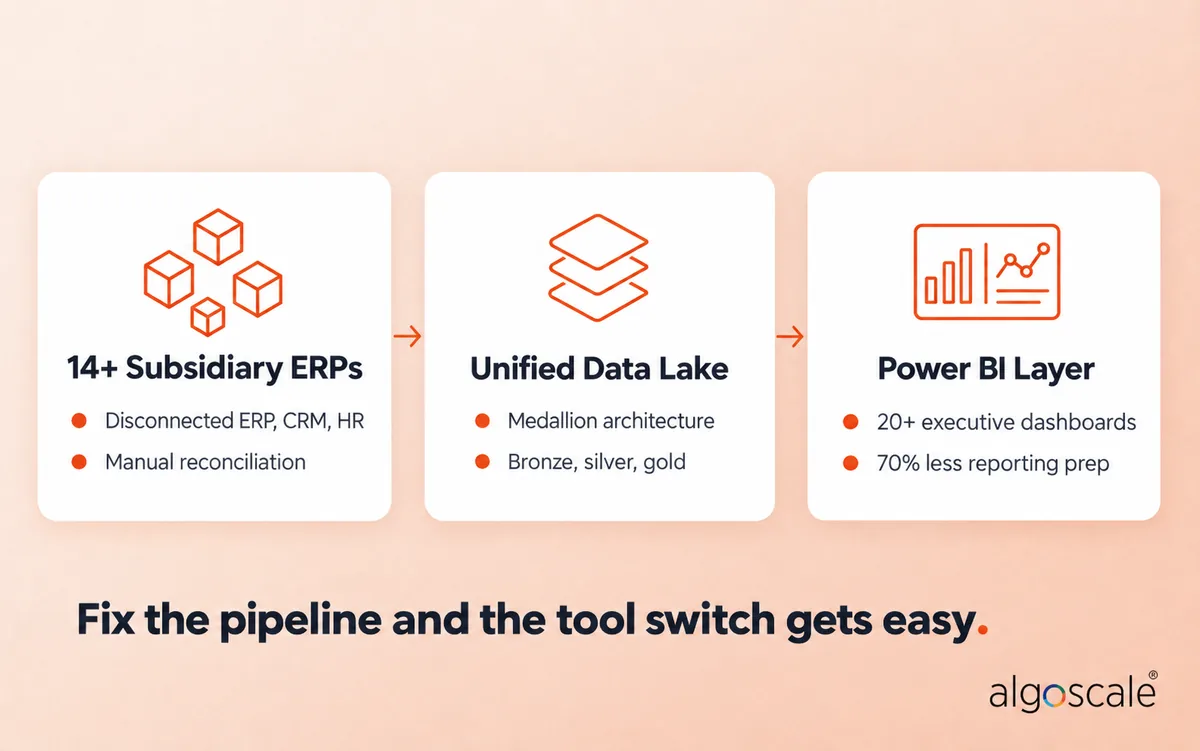
The same principle applies to any BI rollout: the data layer decides whether dashboards succeed. Algoscale tackled this directly for a prominent US physical security and fire systems integrator running 14+ subsidiary companies. Each subsidiary ran its own ERP, and finance was reconciling numbers across disconnected ERP, CRM, HR, and planning systems before anyone could build a report.
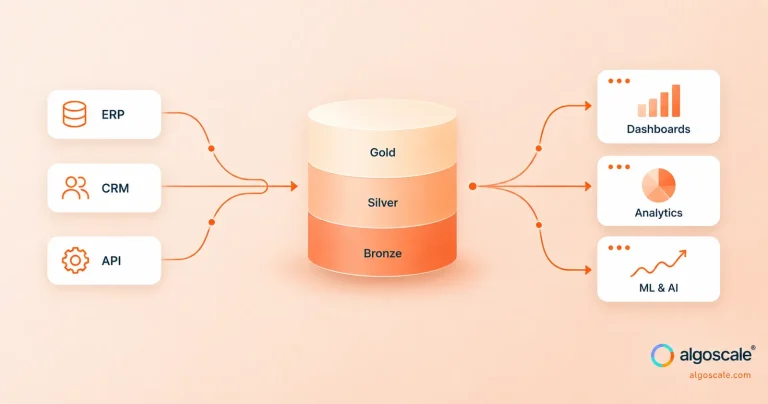
Our team did not simply reskin their dashboards. We overhauled the underlying data layer by unifying every source into a single AWS data lake with a medallion (bronze, silver, gold) architecture, then built a lean, structured semantic layer inside Power BI.
The outcomes were measurable: 20+ executive KPI dashboards in Power BI, a 70% reduction in reporting preparation time, and pipelines that now run twice daily with zero manual triggers. If you resolve the pipeline architecture first, switching tools turns into an enterprise win rather than an endless technical slog.
Is Tableau Still Relevant in 2026?
With Microsoft aggressively bundling its Fabric ecosystem into every corporate contract, people regularly ask: is tableau still relevant in 2026?
Yes. It certainly is.
Is tableau better than power BI for visual data discovery? In many areas, absolutely. If your organisation employs full-time data scientists, mathematicians, or product researchers who need to slice through unmodelled event streams, run clustering algorithms, or produce bespoke geospatial maps, Tableau’s visual flexibility remains top-tier.
Then why is power BI still in demand in 2026?
It rules the broader corporate market. When looking at power BI vs tableau which has more demand, Power BI wins through enterprise ubiquity. Most businesses already run on Microsoft 365. Provisioning an employee with Power BI Pro through Microsoft Entra ID takes moments. For a CFO, a tool that links directly into Office security, costs $14 a month, and feels familiar to Excel users is hard to pass up.
AI Features: Copilot vs Tableau Pulse
Both vendors now sell AI as a headline feature, and both keep it behind pricier plans.
Copilot in Power BI builds visuals, DAX, and summaries from plain-English questions. The catch: it only runs in workspaces on a paid Fabric capacity (F2 or higher). A Pro or PPU licence on its own won’t switch it on.
Tableau Pulse watches your key metrics and flags unusual movements automatically. Tableau Agent, the conversational assistant for building views, sits in the higher-priced Tableau+ edition.
Neither fixes bad data. Point an AI assistant at a messy model, and you get fast, confident, wrong answers. Get the semantic layer right first.
The Broader Market: Looker, Qlik, Excel, and Grafana

Enterprises rarely pick software without checking other market alternatives:
- Looker vs Power BI: Looker runs on LookML, a code-based semantic modelling language. When comparing power BI vs looker, Looker delivers unmatched data governance because definitions live strictly in Git. However, you need software engineers to write and maintain that code, and Google avoids publishing fixed entry-level pricing.
- Qlik vs Power BI: In the power BI vs Qlik space, Qlik Cloud starts around $3,600 a year for 10 users on its Starter tier. Above that, Qlik prices on data capacity rather than seats, so user counts stop driving the bill. Its associative engine is brilliant for uncovering hidden relationships across disconnected tables, though its third-party developer community is considerably smaller than Microsoft’s.
- Power BI vs Tableau vs Excel: These tools complement one another. Excel is an ad-hoc scratchpad for financial scenario modelling; Power BI is a centralised reporting engine for governed corporate metrics.
- Power BI vs Tableau vs SQL: SQL is the foundational database language. You write SQL to stage and transform your tables long before Power BI or Tableau draws a chart.
- Power BI vs Tableau vs Grafana: Grafana tracks server uptimes, CPU spikes, and live infrastructure telemetry. It is an operations tool, not a system for tracking quarterly gross margins.
Learning Curves and Free Tiers
If you are training an internal analytics team, power BI vs tableau which is easier to learn?
Tableau is friendlier on day one for anyone who just wants to turn a spreadsheet into a visual. You drag measures onto rows and see immediate feedback.
Power BI looks deceptively easy because of its Office ribbon, but the learning curve climbs steeply once you dive into DAX. DAX is strict. If an analyst fails to grasp how row context transitions into filter context, their measures will produce confident, completely incorrect calculations.
What about zero-cost entry points? Is power BI or tableau free?
If you want power BI vs tableau free options to experiment with, Power BI Desktop is 100% free on Windows. You can build complete data models and save files locally indefinitely without entering payment details.
Tableau offers Tableau Public. It is free, but every workbook you save must be published openly to the public web. You cannot use it with proprietary corporate numbers. Tableau has since added a Tableau Desktop Free Edition for local analysis of Excel, CSV, and database files, but it cannot publish or share anything. Check any power BI vs tableau reddit thread, and working analysts will agree: Power BI Desktop is still the better private sandbox for local development.
The Biggest Drawbacks of Each Tool
Power BI: Power BI Desktop runs only on Windows, so Mac-based teams need a virtual machine. Pro licences cap each model at 1 GB and 8 scheduled refreshes a day. And DAX punishes shallow knowledge: measures can return confident, wrong numbers.
Tableau: Costs climb with every Explorer and Viewer seat. Heavy data prep needs Tableau Prep or upstream SQL. The most advanced AI features sit in higher-priced editions.
Decision Automation Tool: Which BI Platform Should You Pick?
To cut through vendor marketing, run your project requirements through this simple logical framework:

Step 1: Check Your Core IT Stack
Does your business run heavily on Microsoft 365, Teams, and Azure?
Yes: Choose Power BI. Pro is included in Microsoft 365 E5, and governance runs through Entra ID.
No: Go to Step 2.
Step 2: Identify Primary Users
Are your primary users data scientists who need to explore messy, unmodelled data?
Yes: Choose Tableau. VizQL handles open-ended exploratory queries best.
No: Go to Step 3.
Step 3: Count Your Viewers
Do you have 100+ business staff who only need to check daily dashboards?
Yes: Choose Power BI. It avoids Tableau’s $15/user viewer tax, and on Fabric F64 or higher, viewers need no paid licence at all.
No: Go to Step 4.
Step 4: Assess Internal Engineering Skills
Does your team understand star schemas, SQL, and data modelling?
Yes: Choose Power BI. It extracts maximum speed from VertiPaq.
No: Choose Tableau if your team prefers fast drag-and-drop visuals without strict data modelling. Easier on-ramp, higher annual software cost.
Still split between the two? Our business intelligence consultants can pressure-test the choice against your actual data model before you sign a renewal.
Frequently Asked Questions
Is Power BI better than Tableau?
Neither wins outright. Power BI is the practical choice for governed company reporting, Microsoft ecosystems, and tight software budgets. Tableau is superior for data scientists and specialised analysts who need visual data discovery without rigid modelling.
How much does Power BI cost compared to Tableau?
Power BI Pro costs $14 per user, per month. Tableau uses three tiers: Creators pay $75/month, Explorers pay $42/month, and Viewers pay $15/month (all billed annually, Tableau Cloud Standard).
Can I use either platform for free?
Yes. Power BI Desktop is completely free for local use on Windows machines. Tableau Public is free too, but every dashboard you build must be published to the public internet, making it useless for private business numbers. Tableau Desktop Free Edition lets you analyse local files privately, but you can’t publish or share from it.
What is the main technical difference between them?
Power BI runs on VertiPaq, an in-memory database requiring structured relational models and DAX code. Tableau uses VizQL, which translates drag-and-drop interface moves into direct queries against your tables.
What is the biggest drawback of Power BI?
Power BI Desktop only runs on Windows, and DAX has a steep learning curve that can produce incorrect numbers if the data model is poorly built.
Can you automatically convert Tableau workbooks to Power BI?
No. Microsoft doesn’t ship a converter, and third-party accelerators only cover part of the job. Tableau calculations, especially LOD expressions like FIXED and table calculations, have to be rewritten in DAX, and the data underneath usually needs remodelling as a star schema. Budget for a rebuild, not a file conversion, and run both tools side by side until the numbers match.
How is Microsoft Fabric different from Power BI?
Power BI is the reporting layer. Fabric is Microsoft’s wider data platform that Power BI now sits inside, adding data engineering, warehousing, and a shared lake (OneLake) on one capacity bill. You can run Power BI Pro without Fabric, but Copilot and licence-free report viewing both depend on Fabric capacity.
Is Tableau outdated compared to Power BI?
No. Neither tool is legacy. Power BI ships monthly updates and is being folded into Fabric. Tableau is being rebuilt around Salesforce’s AI and data stack, with Pulse and Tableau Next. When a company calls its Tableau estate “legacy”, it usually means the licence bill no longer fits, not that the tool stopped working.
Does Power BI work on a Mac?
Power BI Desktop doesn’t. Mac users either run Windows in a virtual machine or build in the browser through the Power BI service, which handles reports and some model editing, though Desktop remains the full authoring tool. Tableau Desktop runs natively on both macOS and Windows.