



| Quick Summary — Mobile Business Intelligence (2026) | |
| What it is | Mobile BI delivers real-time dashboards, KPIs, and reports to smartphones and tablets — enabling faster decisions anywhere, anytime. |
| Market size | USD 19.93B in 2025 → USD 55.56B by 2030 (~22.7% CAGR). Over 60% of enterprise analytics queries now start on mobile. (Mordor Intelligence / Gartner) |
| How it works | Four stages: Data Collection → Data Processing → Mobile Delivery (native app / web app / embedded analytics) → User Action. |
| Top 5 tools | Microsoft Power BI, Tableau Mobile, Qlik Sense, SAP BusinessObjects Mobile, Domo — each suited to different tech stacks and user profiles. |
| Key benefits | Instant data access, faster decisions, data democratisation for non-technical users, enhanced customer experience, competitive agility. |
| Key risks | Screen/UX optimisation, offline reliability, and mobile device security (encryption, MFA, remote wipe, role-based access control). |
| Future trends | Conversational BI (NLP queries), AI-driven personalisation, edge computing for low-latency delivery, and IoT device integration. |
| At a glance | Key numbers from this article $55.56B Market size by 2030 60%+ Enterprise queries on mobile 5 tools Reviewed with comparison table 7 Qs Buyer’s checklist included | |
In 2026, when you can order food, book hospital appointments, and transfer money from your phone in seconds, there is no good reason for business leaders to wait until they reach a desktop to get the insights that drive decisions. Mobile business intelligence (mobile BI) is the on-the-go enabler of critical data and insights, allowing decision-makers to access, analyse, and act on important data from any mobile device — anywhere, anytime.
Imagine your retail operations head is travelling when a sudden dip in weekend sales appears across multiple stores just before a major holiday. With mobile BI, they receive an immediate alert on their phone, drill into store dashboards, identify the root cause — a POS outage or understaffed location — and take corrective action within minutes. Without mobile BI, that revenue loss compounds for hours before anyone at a desktop notices.
This blog covers how mobile BI has evolved from traditional desktop tools, why it matters in 2026, how it works technically, which tools lead the market, and how to build a robust mobile BI strategy. For a broader foundation, see Algoscale’s guide to Business Intelligence consulting services and the related deep-dive on data visualization consulting.
What Is Mobile Business Intelligence?

Mobile business intelligence is the capability that lets organisations access and analyse business intelligence (BI)-powered data on smartphones and tablets. It makes data-driven decision-making more flexible and accessible by enabling teams to view and interact with KPIs, dashboards, and reports at any time — eliminating the need for an office desktop or a fixed location.
BI itself is the technology-driven process through which organisations transform raw data into actionable insights using modern dashboards, analytics tools, and reporting systems. Mobile BI brings that capability out of the boardroom and into the field, the shop floor, and the airport lounge.
According to Mordor Intelligence, the mobile BI market reached USD 19.93 billion in 2025 and is forecast to grow to USD 55.56 billion by 2030 — a CAGR of approximately 22.7%. Additional research from Gartner indicates that more than 60% of enterprise analytics queries are now initiated on mobile devices, reflecting a fundamental shift in how business users interact with data.
Key enablers of this growth include widespread 5G availability (reducing latency), cloud computing (enabling instant synchronisation across devices), edge computing (processing data closer to the source), and the integration of generative AI to simplify natural language data queries for non-technical users.
Traditional BI vs Mobile BI: How Mobile Business Intelligence Has Evolved
Business intelligence has moved through three broad generations. Understanding this progression makes clear why mobile delivery is not a feature add-on but a fundamental shift in how organisations consume data.
| Trait | Gen 1: IT-Led BI | Gen 2: Self-Service BI | Gen 3: Mobile / Augmented BI |
| Access | IT department only | Data analysts & business users | Everyone, any device, anywhere |
| Delivery | Scheduled static reports | Interactive desktop dashboards | Real-time mobile alerts & dashboards |
| Speed to insight | Days to weeks | Hours to days | Minutes to seconds |
| AI / Automation | None | Limited (ad-hoc queries) | AI-driven anomaly detection & NLP |
| Limitations | Bottlenecked on IT, slow | Desktop-bound, needs data skills | Security & screen-size challenges |
Generation 1 — IT-Led Reporting
The first generation of BI was entirely managed by IT departments. ETL (Extract, Transform, Load) pipelines unified data from disparate sources into a central warehouse. Queries were submitted by business users and fulfilled by IT specialists, often taking days or weeks. Reports were static and any follow-up question restarted the cycle. Business leaders had limited direct access to data and no ability to explore it themselves.
Generation 2 — Self-Service Analytics
Self-service business intelligence services changed that. Tools with drag-and-drop data discovery and interactive visualisation put dashboards directly in the hands of data analysts and, increasingly, non-technical business users. IT’s role shifted from report producer to data infrastructure owner. However, these tools remained desktop-bound — useful in the office, useless in the field.
Generation 3 — Mobile and Augmented BI
The pandemic of 2020 accelerated a trend already underway: teams needed insights to reach them wherever they were working. Smartphones, 5G, and cloud infrastructure made real-time mobile data delivery practical. Augmented analytics — AI and ML capabilities embedded in BI tools — further reduced the need for specialist data skills, making mobile BI accessible to frontline employees who had never previously touched a dashboard.
Why Is Mobile Business Intelligence Important For Enterprises In 2026?
Enterprise teams, leaders, and frontline managers operate across different time zones and locations. Business performance changes by the minute. Agility, real-time alerts, and self-service insights available on smartphones help enterprises identify opportunities and issues sooner, accelerate decisions, and eliminate reporting bottlenecks.

1. Instant Access to Key Information
Mobile BI gives enterprise teams instant access to metrics, KPIs, and dashboards regardless of location. Whether travelling, working remotely, or preparing for a critical meeting, teams can pull moment-critical data on their smartphones. Delays in recognising and acting on key signals — a sudden traffic spike, a supply shortfall, a payment failure — translate directly into revenue loss.
2. Agility and Competitive Edge
The thin line that separates leading businesses from the rest is responsiveness: being present for customers and meeting dynamic demand before competitors do. Mobile BI enables the continuous monitoring and rapid response that agility requires. A documented example from the FMCG sector: Coca-Cola deployed mobile BI tools to enable sales teams to access real-time vending machine performance and inventory data in the field, allowing faster restocking decisions and measurable improvements in sales uptime. (Source: SAP case study archive, 2023.)
3. Data Democratisation
Mobile BI platforms are designed with non-technical users in mind. Natural language processing (NLP) and intuitive touch interfaces mean that everyone — from a warehouse supervisor to a regional sales director — can access the right data independently, without waiting for a data analytics consultant or BI specialist to run a query for them. This democratisation eliminates bottlenecks and improves organisational agility.
4. Enhanced Customer Experiences
Tools such as Power BI offer interactive mobile reports that give customer-facing teams real-time visibility into service issues, demand patterns, and customer behaviour. With actionable data always to hand, teams can resolve issues before they escalate, personalise service interactions, and consistently meet customer expectations — all drivers of retention and revenue growth.
How Does Mobile Business Intelligence Software Work?
Mobile BI enables users to access, visualise, and analyse business metrics in real time on mobile devices. The process runs through four sequential stages:
| ① Data Collection ERP, CRM, cloud services unified via APIs into a central warehouse | → | ② Data Processing Cleaned, transformed, indexed & aggregated for fast mobile queries | → | ③ Mobile Delivery Native apps, web apps, or embedded analytics deliver insights to devices | → | ④ User Action Drill-downs, alerts, collaboration, and real-world decisions made on-device |
1. Data Collection
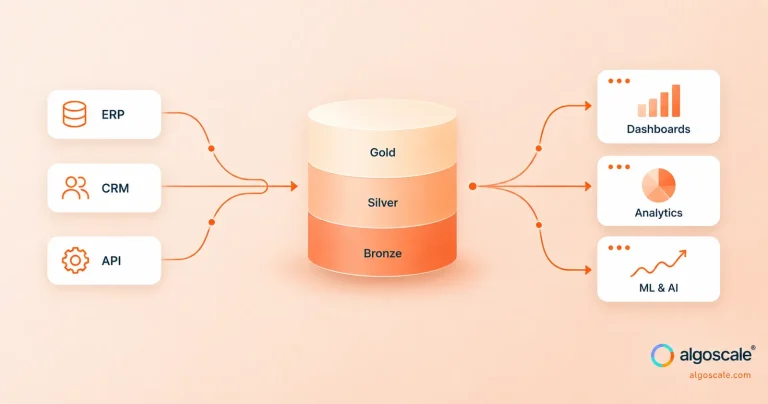
Mobile BI pulls data from various sources — ERP systems, databases, cloud services, and CRM tools — unifying it into a central repository or data warehouse. Connectors and APIs stream this information in, standardising formats and timestamps so that every mobile dashboard presents information from the same unified, updated source.
2. Data Processing
This stage covers cleaning, transformation, and organisation. The software extracts, loads, and transforms raw data, removing duplicates and calculating metrics. AI-powered data engineering tools automate much of this work at scale. Data is then indexed, aggregated, and refreshed on streams to accelerate dashboard loading on mobile devices — keeping latency low even on 4G connections.
3. Mobile Delivery
Insights reach users through one of three channels:
- Native mobile apps (iOS/Android): Fastest performance, offline access, push notifications, and full device hardware integration (camera, GPS, biometrics). Recommended for power users and field teams.
- Web apps (browser-based): Platform-agnostic and faster to deploy. Best for occasional users or organisations with mixed device fleets.
- Embedded analytics: BI capabilities integrated directly into existing operational apps (e.g., CRM, ERP mobile clients), so users never have to leave the tool they already use.
4. User Interaction and Action
With insights delivered on device, users access dashboards, drill into details, configure alerts, and share findings with colleagues. This is the stage where processed data produces real-world outcomes: a logistics manager reroutes a shipment, a store supervisor reallocates staff, a financial controller approves a purchase. The value of mobile BI is realised only when insights translate into action — and reducing friction at this stage is the primary design goal of any well-built mobile BI solution.
| Not sure which mobile delivery method — native app, web app, or embedded analytics — fits your team’s workflow and data stack? Our BI architects can map the right architecture to your specific use case. Talk to Algoscale’s BI team → |
Why Is a Native Mobile Business Intelligence Solution Important?
The viewing experience should not be compromised when users move from desktop to smartphone. Native mobile BI solutions offer a consistent look and feel across sessions and eliminate the need for constant redesign as screen sizes, operating systems, and app stores evolve.
1. Top-Notch Performance
Native apps are optimised end-to-end for their specific platforms — iOS or Android — using the core programming languages and APIs of each OS. Visual elements and cached data stored on the device allow faster load times than web apps, which depend on remote server round-trips. For field users in areas with limited connectivity, this difference is the difference between an insight available and an insight missed.
2. Intuitiveness
Native solutions follow strict platform UX guidelines — Human Interface Guidelines for iOS, Material Design for Android — creating a familiar, intuitive flow that reduces the learning curve for new users. Direct access to device hardware (camera for scanning barcodes, GPS for location filtering) further enhances the user experience and opens use cases that web apps cannot support.
3. Enhanced Security
Native apps benefit directly from platform-level security updates, hardware-backed key storage, and biometric authentication frameworks. Web apps depend on a variety of browsers and third-party technologies with non-standardised security models, creating a wider attack surface. For organisations handling sensitive financial, healthcare, or customer data on mobile devices, native security architecture is not optional.
What Are the Essential Components of a Mobile BI Strategy?
Building a successful mobile BI capability requires deliberate decisions across three areas. Engaging experienced business intelligence consulting services ensures these components are designed cohesively rather than bolted together.
1. Architecture
The architecture must balance performance, security, and user experience while ensuring compatibility across all target devices and operating systems. Key design priorities include: responsive layouts that adapt to different screen sizes without manual redesign; rigorous cross-device testing; appropriate visual aids for small screens (fewer metrics per view, larger tap targets, thumb-friendly navigation); and a choice between cloud-hosted and on-premises deployment based on your data governance requirements.
2. User Roles
Different users need different data at different levels of detail. A CFO reviewing quarterly performance needs different mobile views from a field sales rep checking a single account. Role-based access control — mapping data types, dashboard views, and drill-down permissions to job function and seniority — ensures each user sees the right information without unnecessary complexity or security risk.
3. Security
Security must be integrated from the outset, not retrofitted. Comprehensive mobile BI security includes encryption at rest and in transit, multi-factor authentication, role-based access control, remote wipe capability for lost or stolen devices, VPN support for corporate networks, and intrusion detection. Algoscale’s data governance consulting practice covers the full security architecture for mobile data environments.
Key Features of Mobile BI Applications
1. Real-Time Data Access
Mobile BI enables real-time access to live data — sales numbers, supply chain status, website traffic, customer behaviour — so that teams can respond to the market’s dynamic needs without delay. This immediacy is a core differentiator vs static data analytics reporting. Proactive anomaly detection alerts — triggered when a KPI crosses a threshold — mean teams are notified of issues before they escalate.
2. AI and Predictive Analytics
Modern mobile BI solutions embed AI capabilities including natural language querying, automated anomaly detection, predictive modelling, and what-if scenario analysis. Augmented analytics reduces the specialist knowledge required to extract value from data — a key enabler of data democratisation. Geospatial analytics (location-aware filtering and mapping) adds further contextual relevance for field teams.
3. Cloud-Based Integration
Cloud-based integrations ensure data is consistently updated, secure, and accessible across all locations and devices. This enables distributed and remote teams to collaborate on the latest dashboards without the latency and maintenance overhead of on-premises systems. Algoscale’s cloud application development and Microsoft Azure development services support cloud-native BI deployments at enterprise scale.
4. Data Storage
Mobile BI solutions store business data in columnar, relational, and multi-dimensional formats within an enterprise data warehouse, with metadata managed through data catalogues and business glossaries. This accelerates query processing, ensures reliable analytics, and minimises duplication — allowing users to explore data confidently from any device.
5. Interactive Visualisations and Dashboards
The best data visualisation approaches for mobile BI optimise dashboards for all screen sizes and touchscreen interaction. Users can drill into data, apply filters, and generate custom views with a few taps — replacing static reports with living, responsive data surfaces. Effective mobile dashboard design follows the principle of progressive disclosure: show the most critical metric first, allow the user to dig deeper only if they choose to.
6. Offline Access
Offline access allows users to view cached reports and dashboards without an internet connection — essential for field workers, travellers, and teams in environments with unreliable connectivity. Push notifications for critical updates ensure that no important event is missed, even when a user returns to connectivity after a period offline.
Top 5 Mobile Business Intelligence Tools for 2026
Choosing the right mobile BI tool depends on your existing technology stack, user profile, security requirements, and budget. Below are the five leading platforms, followed by a comparison table to help you evaluate them side by side.
1. Microsoft Power BI
Power BI offers touch-enabled dashboards and reports across iOS, Windows, and Android. It is the strongest choice for organisations already using Microsoft 365, Azure, or SQL Server. Hire Power BI developers through Algoscale to build mobile-ready interactive reports with live data access, NLP querying, geographic filtering, and push notification alerts. Power BI Mobile integrates directly with Power BI Service and Power BI Report Server.
2. Qlik Sense
Qlik Sense is popular for its Associative Engine, which enables users to explore data intuitively and discover non-obvious relationships. It offers AI-powered analytics, NLP querying, offline access, and a responsive touch-optimised UI with automated layout adjustments for mobile screens.
3. SAP BusinessObjects Mobile
SAP BusinessObjects Mobile is the natural choice for organisations already running SAP enterprise solutions. It offers enterprise-grade security, geo analytics, native rendering, and interactive prompts and filters on dashboard reports — all within the familiar SAP governance framework.
4. Domo
Domo is designed explicitly for non-technical users and requires no complex setup. It offers real-time dashboards with over 150 chart types, self-service filtering for ad-hoc analysis, and a built-in chat feature called ‘Buzz’ for discussing insights and assigning actions directly within the platform.
5. Tableau Mobile
Tableau Mobile delivers enterprise-wide BI distribution with AI-driven insights from Tableau Pulse, seamless connection to Tableau Server/Cloud, offline access for preferred dashboards, and touch-friendly drag-and-drop functionality. For organisations evaluating Tableau against other options, Algoscale’s comparison of Power BI alternatives provides a detailed analysis. To implement Tableau for your organisation, hire a Tableau developer from Algoscale’s certified team.
Mobile BI Tools Comparison — use this table to align tool capabilities with your requirements:
| Tool | Best For | Offline Access | AI / NLP | Price Tier |
| Microsoft Power BI | Microsoft 365 ecosystems, enterprise reporting | Yes | Copilot / NLP queries | Free–$10/user/mo |
| Tableau Mobile | Advanced visual analytics, large data sets | Yes (favourites) | Tableau Pulse AI | From $15/user/mo |
| Qlik Sense | Associative exploration, self-service BI | Yes | Insight Advisor AI | Quote-based |
| SAP BusinessObjects | SAP-native enterprises, geo analytics | Limited | SAP Analytics Cloud | Enterprise quote |
| Domo | Non-technical users, collaborative BI | Limited | Domo.AI assistant | Quote-based |
| Operating in healthcare, retail, or financial services? See how Algoscale has built mobile BI solutions for teams in your sector — and get a free consultation on the right tool and architecture for your data environment. Talk to our BI experts → |
Use Cases for Mobile BI Software
Finance
Mobile BI helps financial services firms access real-time performance metrics, financial reports, and cash flow forecasts from any location. A regional finance director can review variance against budget during a board meeting without waiting for an analyst to run a report. Industry data from Deloitte’s 2024 CFO Survey indicates that organisations with real-time mobile financial dashboards reduced reporting lag by an average of 68%, directly improving cash flow management and faster capital allocation decisions.
Sales
Sales teams use mobile BI to access real-time sales data, customer records, and product information before and during client meetings — improving deal closure rates and forecast accuracy. Power BI consulting services from Algoscale can deliver tailored mobile dashboards, automated real-time data pipelines, and mobile-ready reports that give field sales teams the same visibility as their office-based counterparts.
Retail
Retailers use mobile BI for instant visibility into sales trends, inventory levels, and customer behaviour across locations. Retail data analytics delivered on mobile allows store managers to react to localised demand shifts in real time — adjusting pricing, reallocating stock, or modifying staffing without waiting for a head-office report. One mid-size fashion retailer deploying Algoscale’s mobile BI solution reported a 34% reduction in stockout incidents within six months of go-live, driven by real-time inventory alerts on mobile devices.
Healthcare
Mobile BI helps healthcare providers access lab results, patient records, and clinical dashboards instantly — whether in transit between facilities or at the bedside. Real-time, accessible data reduces risks including delayed interventions, duplicated tests, and miscommunications between care teams. According to a 2024 survey by the Healthcare Information and Management Systems Society (HIMSS), clinicians with mobile access to BI dashboards reported a 41% improvement in time-to-decision for non-emergency interventions.
Manufacturing
Mobile BI helps manufacturers track production data, machine performance, inventory levels, and quality metrics in real time — detecting bottlenecks, reducing unplanned downtime, and optimising delivery schedules before delays become costly. A plant manager with mobile BI can respond to an OEE (Overall Equipment Effectiveness) alert within minutes rather than discovering a machine outage at the next shift handover.
Buyer’s Checklist: 7 Questions to Ask Before Choosing a Mobile BI Solution
Before committing to a mobile BI platform, use the following checklist to evaluate whether a solution truly fits your organisation’s needs — not just its feature marketing:
| Question to Ask | Why It Matters |
| Does it support native iOS and Android apps? | Native apps outperform web apps on load speed, offline access, and device integration (camera, GPS, biometrics). |
| What is the offline capability? | Field teams and travellers need cached dashboards and push alerts even without internet connectivity. |
| How is sensitive data secured on mobile? | Look for end-to-end encryption, multi-factor authentication, remote wipe, and role-based access control. |
| Does it support responsive/adaptive layouts? | Dashboards authored once should auto-adapt to phone, tablet, and desktop without manual redesign. |
| What AI features are included? | Natural language querying, predictive alerts, and auto-generated narratives reduce dependence on data specialists. |
| How does it connect to your existing data stack? | Check connectors for your CRM, ERP, data warehouse, and cloud services before committing. |
| What are the total cost of ownership and scalability limits? | Evaluate per-user licensing, data volume caps, and professional services fees as your team grows. |
Tip: Request a proof-of-concept with your own data before signing a contract. The best mobile BI vendors will accommodate a structured evaluation period. Algoscale’s BI team can run a tool-agnostic assessment to match your requirements to the right platform.
Common Challenges of Mobile Business Intelligence
1. Usability
Choosing a delivery channel is not the same as designing a great user experience. Mobile BI interfaces must be designed for the operational scenarios of your specific users — including their level of technical familiarity, the physical environment they work in (gloves, bright sunlight, moving vehicles), and the type of decision they need to make. Generic dashboards ported from desktop to mobile frequently fail at this point.
2. Screen Size and Browser Optimisation
Desktop dashboards cannot simply be displayed on a phone screen. Different screen sizes, aspect ratios, and browser rendering engines create significant design challenges. The solution is responsive design combined with rigorous cross-device testing — not a one-size-fits-all layout.
3. Security
Personal devices may lack enterprise security protocols. Without encryption, multi-factor authentication, and remote wipe capability, sensitive dashboards on lost or stolen phones become a serious data breach risk. Algoscale’s data governance consulting practice designs mobile BI security architectures that satisfy both IT governance requirements and end-user experience expectations.
Best Practices for Mobile Business Intelligence
1. Avoid Dashboard Complexity and Proliferation
An ‘author once, distribute everywhere’ approach — creating dashboards once and making them available across all relevant devices — eliminates the overhead of maintaining separate desktop and mobile versions. Dashboards should adapt to device context rather than requiring manual redesign for each screen size.
2. Design With Mobile Users in Mind
Mobile users are typically on the move and looking for high-level takeaways, not deep analytical exploration. Design dashboards that surface the most important metric immediately (top-left positioning, where eyes naturally start), offer simple drill-down for those who need detail, and apply role-appropriate filters by default to reduce cognitive load.
3. Optimise Form Factor for Mobiles and Tablets
Smaller screens require deliberate prioritisation. Avoid overcrowding with too many chart types or metrics per view. Limit each mobile dashboard to three to five KPIs maximum, use large tap targets, and test on actual devices — not just browser emulators — to validate usability.
4. Security Optimisation
Implement a multi-tiered security model: user authentication at login, encryption for all data in transit and at rest, role-based access to prevent unauthorised data exposure, and periodic access reviews as team structures change. Treat mobile devices as potential entry points for attackers and design accordingly.
5. Prioritise Knowledge Sharing and Collaboration
Mobile BI is most valuable when insights can be shared and discussed in context. Ensure your chosen platform supports in-app annotation, dashboard sharing, and integration with collaboration tools (Slack, Teams, or email) so that a field insight can reach the right decision-maker within seconds of being discovered.
Future Trends in Mobile Business Intelligence
1. AI and ML Integration
Hyper-personalised analytics — dashboards that adapt to individual user behaviour, proactively surface relevant insights, and explain anomalies in plain language — will become the standard expectation. According to Gartner’s 2025 Magic Quadrant for Analytics and BI Platforms, over 75% of leading BI vendors have committed to embedding generative AI capabilities directly into their mobile experiences by 2026.
2. Cloud-First and Edge Computing
Cloud platforms offer enhanced flexibility and scalability for data architecture, while edge computing facilitates faster data processing for real-time mobile experiences — particularly in manufacturing, logistics, and healthcare environments where latency is critical.
3. Conversational BI
Natural language interfaces — type or speak a question, receive a chart or summary — will grow rapidly as NLP capabilities improve. Conversational BI dramatically lowers the barrier to data access for non-technical users and is already available in Power BI (Copilot), Qlik (Insight Advisor), and SAP Analytics Cloud.
4. IoT Integration
Mobile BI interfaces will become the primary monitoring surface for interconnected IoT device networks — production sensors, delivery fleet telemetry, connected medical equipment. The combination of big data engineering and mobile BI creates a real-time operational intelligence layer that was not previously possible at scale.
5. Self-Service Analytics
AI-powered self-service analytics — dashboards that personalise views, auto-generate insights, and explain statistical patterns in plain language — will enable organisations to move faster and maintain compliance simultaneously. Algoscale’s data visualization consulting services deliver this capability through purpose-built mobile BI solutions.
Conclusion
Mobile business intelligence has shifted from a convenience to a competitive necessity. In 2026, having more data is not enough — businesses must make the right data available at the right time, in the right format, on the device their teams are actually using. Mobile BI delivers the immediacy, collaboration, and decision-making velocity that the pace of modern business demands.
At Algoscale, we design and deploy mobile BI solutions that deliver secure, interactive dashboards and actionable data directly to smartphones and tablets — from initial BI strategy through to implementation and ongoing support. Our certified Power BI developers and Tableau consultants build mobile-first BI ecosystems that scale with your organisation and reflect the latest platform capabilities. Get in touch for a free consultation.
Frequently Asked Questions
1. What is mobile business intelligence?
Mobile business intelligence is the capability that lets organisations access and analyse BI-powered data on tablets and mobile devices. It makes data-driven decision-making more flexible and accessible by enabling teams to view and interact with KPIs, dashboards, and business metrics at any time — without needing an office desktop.
2. What is mobile business intelligence software?
Mobile BI software is a system through which users access and analyse business data on mobile devices including smartphones and tablets. These tools provide real-time data, on-the-go insights, offline access, interactive visualisations, and conversational AI querying for decision-makers in the field.
3. What are some popular mobile BI tools?
The leading mobile BI tools include Microsoft Power BI, Tableau Mobile, Qlik Sense, SAP BusinessObjects Mobile, and Domo. Power BI is best for Microsoft-centric environments; Tableau for advanced visualisation and large data sets; Qlik for associative data exploration; SAP for enterprise SAP ecosystems; and Domo for non-technical users requiring collaboration features.
4. Tableau vs Power BI — which is better for mobile?
Choose Power BI Mobile if your organisation uses Microsoft 365/Azure, requires quick deployment with a lower learning curve, or needs a cost-effective option for a large user base. Choose Tableau Mobile if you require platform-agnostic flexibility, deep customisation for advanced analytics, or work continuously with very large or complex data sets. Both tools are strong; the decision is primarily determined by your existing technology stack.
5. How do I measure the ROI of mobile BI?
ROI from mobile BI can be measured across four dimensions: (1) time saved — reduction in hours spent waiting for reports or travelling to a desktop; (2) decision speed — reduction in time-to-action for operational decisions; (3) error reduction — fewer decisions made on stale or incomplete data; and (4) revenue impact — revenue protected or generated through faster responses to sales opportunities, demand signals, or operational issues. Establish baseline measurements before deployment and track at 3, 6, and 12 months post-launch.