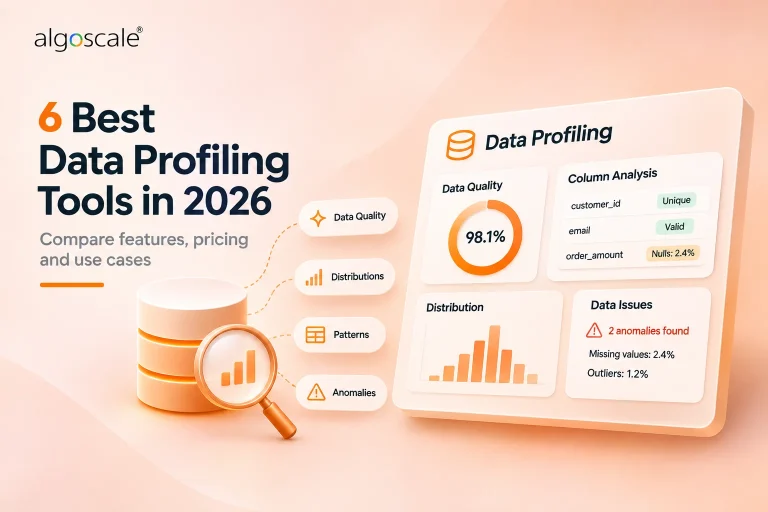


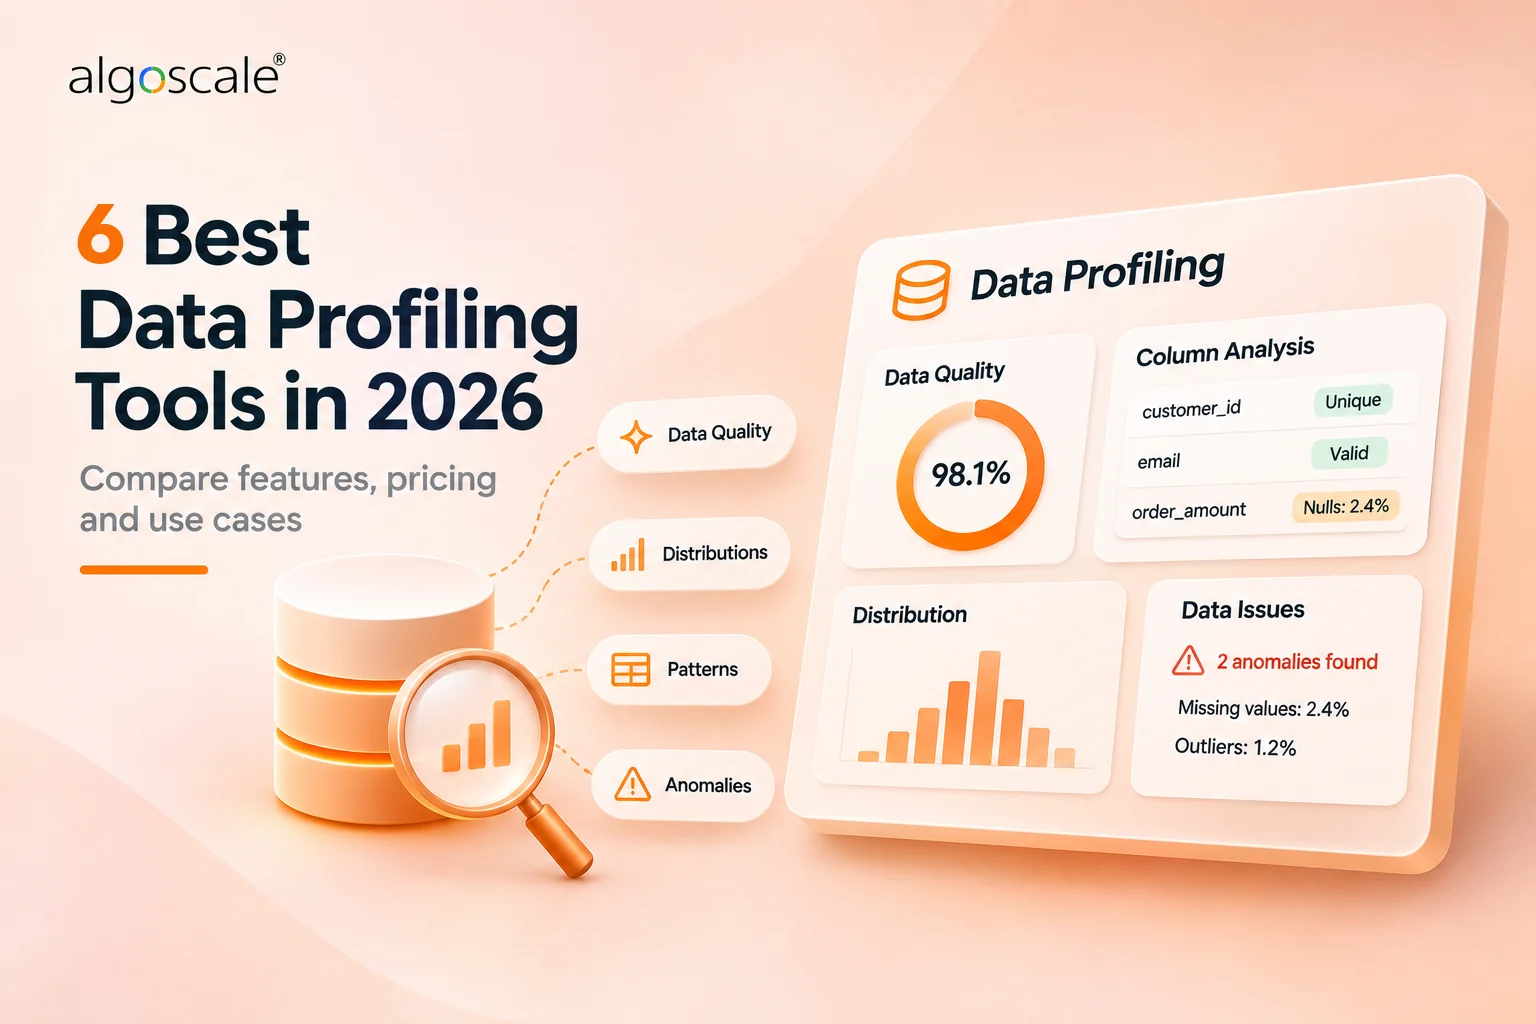

Data profiling tools tell you what is actually in a table before you trust it: the types, the nulls, the distinct values, the outliers and, on the better ones, which columns could serve as keys. That last part is where the six tools on this page split. Four profile one table, file or query at a time. Two of them, Ataccama ONE and IBM InfoSphere Information Analyzer, look across tables for primary keys, foreign keys and the gaps between them.
The list divides the way searches for this term do, with open source data profiling tools on one side and enterprise platforms on the other. Three cost nothing to start: ydata-profiling, Power Query in Power BI Desktop, and OpenRefine. AWS Glue DataBrew bills by the minute, and Ataccama and IBM sell by quote.
One change that no ranking page we read mentions yet: ydata-profiling, the most-searched name in this category, has been renamed fg-data-profiling, and the old package gets no further updates. Every price and limit below was read on the vendor’s own page on 14 November 2026. We did not trial any of the six.
6 Best Data Profiling Tools: Quick Comparison
| Tool | Best For | Public Reviews | The Catch | Starting Price | Finds Keys Across Tables? | Access |
|---|---|---|---|---|---|---|
| 1ydata-profiling | Python teams profiling dataframes | Hacker News and GitHub: a full report from a couple of lines; a 2025 bug report logs 16GB+ memory on a 5MB frame | Renamed; the old package gets no fixes | Free (MIT) | No: one DataFrame at a time | pip install, no account |
| 2Ataccama ONE | Enterprises needing key discovery | PeerSpot: slow on huge volumes for one MDM user; documentation hard going at first for another | No public price, no trial since 2025 | Not public | Yes, in ONE Desktop: primary keys, foreign keys and dependencies | Sales call only |
| 3Power Query | Power BI and Excel analysts | Hacker News: made transformation easy for operations staff; power users want a better editor and profiler | Profiles the first 1,000 rows by default | Free in Power BI Desktop; Pro $14.00 user/month, paid yearly, to share | No: one query’s columns | Free Windows download |
| 4AWS Glue DataBrew | AWS teams avoiding code | Hacker News: one 2026 comment, scathing about the interface; no G2 or PeerSpot listing of its own | AWS only, and profile jobs never free | $0.48 per node-hour for profile jobs | No: correlations within one dataset | AWS account; 40 free sessions for first-time users |
| 5IBM InfoSphere Information Analyzer | Existing InfoSphere customers | PeerSpot: good at profiling and discovery; the setup called complex | Bundle pricing, and IBM’s focus has moved | Not public | Yes: key, cross-domain and referential-integrity analysis | Sales call only |
| 6OpenRefine | Solo analysts with one file | Hacker News: found duplicates a script would have missed; crashed merging a 10k-entity subset | 1 GB memory by default, one user | Free (BSD-3-Clause) | No: facets on one file | Free download, no account |
Not sure which of these fits your stack?
Tell us what you are running today and what you need it to do. We will tell you which of these we would pick, and why. We are not going to pitch you.
How We Researched These Data Profiling Tools
We started from the desktop and mobile search results for this term: 17 sources, Google’s AI Overview among them. Two were Reddit threads we could not open. Six of the others publish a ranked list, and three of those six come from vendors that put their own product first: OvalEdge, Alation and DataKitchen.
Nothing was trialled and no account was created. Ataccama has offered no free trial since April 2025, DataBrew needs an AWS account, and Information Analyzer is licensed on-premises software with no public trial. So there is no logged-in screenshot in this post; the profile screenshots are the vendors’ own published examples. Prices, limits and features come from each vendor’s pricing pages and documentation, read on 14 November 2026.
We read about 135 public comments, review excerpts and bug reports: 33 for ydata-profiling across Hacker News and GitHub, about 40 Hacker News comments each for Power Query and OpenRefine, 14 for DataBrew, and four PeerSpot excerpts each for Ataccama and IBM. G2, Reddit and Capterra block automated reading and we do not work around that, so no G2 figure appears below.
DataOps TestGen was on our first list and came off it: we found no independent public review of it anywhere we could reach, and IBM’s Information Analyzer took the slot. DataCleaner is named by four sources but has shipped one release in four and a half years. Informatica, Collibra and Alation are left out because other comparisons on this site already rank them. The order runs from the widest fit to the narrowest.
What we weighed, heaviest first:
- How fast you get a first profile – a pip install, a download and a sales call are three very different first weeks, and a profile is usually wanted before any budget exists
- Whether you can see the price – three of the six are free and one publishes a per-minute rate, while two print no figure at all
- Whether it looks across tables – column statistics miss the orphaned keys and broken joins that sink a migration, and only two entries document key discovery
- How much data it takes before it struggles – row defaults, memory ceilings and node counts decide whether the profile covers the table or a sample of it
- Where the findings go next – a profile matters only once it becomes a fix, a key decision or a rule, and some of these tools hand that step straight on while others leave it with you
What Data Profiling Checks, and What It Leaves to Quality and Observability Tools
Data profiling is the look you take before you build anything: before a migration, a model or the first quality rule. Fivetran’s guide splits it three ways. Structure profiling checks types, formats and lengths. Content profiling counts nulls, distinct values and outliers. Relationship profiling finds the columns that could be keys, along with the rows that would break a join.
Testing comes after profiling. A profile tells you what is there; a test fails a load when something changes. Great Expectations, the testing framework named in Google’s AI Overview beside these tools, no longer profiles at all. Its March 2024 community roundup announced that the Profiler and Data Assistant APIs were being removed, and the GX Core release notes show the rule-based profiler removed in 1.5.1 and the profile module in 1.16.0. Nothing up to 1.25.0, released on 12 November 2026, has brought profiling back.
| What you are trying to do | What you need | Where to look |
|---|---|---|
| Find out what is in a source before you migrate it, model it or write rules for it | A data profiling tool | This page |
| Profile a source nobody has looked at in years, with the cleansing rules on the same contract | An enterprise data quality suite | Our data quality tools comparison, where Informatica and Qlik Talend cover that case |
| Turn what a profile found into checks that run on every load | A data quality testing tool | dbt, Soda and Great Expectations, ranked in that same comparison |
| Watch production tables for freshness, volume and drift | A data observability tool | Our data observability tools comparison |
| Match and merge duplicate customer records across systems | Master data management | Our master data management tools comparison |
| Find out why your code is slow | A code profiler | Not covered here |
- DataCleaner is the older open-source profiler you will see on other lists. Its last release, 5.9.0, came in November 2024, the first since February 2022. For open-source checking tools such as Deequ, see our open-source data quality tools round-up.
1. ydata-profiling (now fg-data-profiling): Best for Python Teams Who Want a Profile From One Line of Code

What it does: An open-source Python library that turns a pandas DataFrame, or a Spark DataFrame in a reduced mode, into an HTML or JSON profile report from a single ProfileReport call. The package has been renamed fg-data-profiling.
Who this is for: Data scientists and data engineers who already work in Python notebooks or Spark and want Python data profiling as a quick first look at one table or file before they model or load it.
Most readers arrive here having searched for this library under one of its names. Pandas-profiling became ydata-profiling, and ydata-profiling is now fg-data-profiling: PyPI says the old package “will no longer receive updates or bug fixes” (read 14 November 2026). Install fg-data-profiling and change the import from ydata_profiling to data_profiling.
One ProfileReport call produces an HTML report covering every column: types, missing cells, duplicates, outliers and correlations. For larger datasets the docs recommend a minimal configuration with the expensive computations off, or a sample. Spark runs in a reduced mode that still lacks missing-values analysis and interactions.


Key Features
- One ProfileReport call produces an HTML or JSON profile of a pandas DataFrame
- Spark DataFrame support in a reduced mode: univariate statistics, head and tail samples, Pearson and Spearman correlations
- A minimal configuration and sampling options for larger datasets
Pros and Cons
Pros
- Free under the MIT licence, with nothing to sign up for: pip install and run
- Spark support means the same tool can run on the cluster where the data already sits
- Still released under its new name, with 4.20.0 out in September 2026
Cons
- The rename means the old ydata-profiling package gets no more fixes, and every import has to change
- Memory use can run away on small frames: a 2025 bug report logs 16GB+ on a 5MB, 40k-row DataFrame
- It profiles one DataFrame at a time and does not discover keys or relationships across tables
What Users Say
Try the Pandas Profiling library [0]. Why do all the clicking and plotting and specifying variables when you can have a couple lines of code do it all for you?
telchar on Hacker News, 13 February 2022Written when the library was still called Pandas Profiling.

Analyzing the supplied 40k-rows-by-16 (5MB)
jobh on GitHub, issue #1749, 2 April 2025This is a bug report. The reporter first hit the problem in time-series mode, then posted a MemoryError with time-series mode switched off. Setting pool_size=1 cut peak memory, and a third commenter says the error no longer reproduces on the develop branch.pd.DataFrameeats 16+GB of memory on a 16-core machine

Pricing
Free. MIT licence, installed with pip install fg-data-profiling. The current release is 4.20.0, out on 11 September 2026, and the library has no paid tier.
The last release under the old name was ydata-profiling 4.18.4, on 22 April 2026. Anything pinned to that package stays there.
Bottom Line
Run it on any single table you can load into Python. On a large one, start from the minimal configuration or a sample, and keep an eye on memory during the first run.
The right first profile for most teams, as long as you install it under its new name and do not need keys found across tables.
2. Ataccama ONE: Best for Enterprises That Need Keys and Dependencies Found Before Writing Rules

What it does: An enterprise data quality platform whose profiling detects patterns and distributions and feeds data quality rules. Its licensed ONE Desktop client documents primary-key, foreign-key and dependency analysis across inputs.
Who this is for: Enterprise data governance and data quality teams with many source systems, a security review to pass, and the budget for a quote-based licence priced on named users and data objects.
The advanced analyses in Ataccama’s ONE Desktop client test whether columns are unique enough to serve as primary keys, whether a key in one input can be a foreign key to another, and whether one column’s values depend on another’s. That last check appears in no other entry here.
All three analyses are documented in ONE Desktop, a licensed download with a 16 GB RAM minimum. The web platform’s page says only that it profiles datasets for patterns and distributions. Findings feed quality rules on the same platform, and our data quality tools comparison judges that side of the product.


Key Features
- Profiles datasets for patterns and distributions and turns the findings into data quality rules
- Primary-key (uniqueness) and foreign-key analysis across two inputs, in the ONE Desktop client
- Dependency analysis between determinant and dependant columns, in the ONE Desktop client
Pros and Cons
Pros
- Profiling results flow straight into data quality rules on the same platform
- ISO 27001:2022 and an annual SOC 2 Type II audit help it through a security review
- View-only users are unlimited at every tier, according to the pricing page
Cons
- There is no public price and no free trial: Ataccama’s community admin wrote on 28 April 2025 that “we don’t offer free trials anymore”
- One PeerSpot reviewer, using it for master data match-and-merge, says it slows on large volumes
- Active DQ configurations are one of the three things that set the tier, so the number of checks you run feeds into the quote
What Users Say
the performance or speed gets slow when there is huge data.
Dm-Dm, data engineer at a tech vendor with 10,001+ employees, on PeerSpot, 11 December 2025

It was a little tough for my team to learn and start using Ataccama ONE Platform because the documentation at that time was not good.
Akhil Danturti, Data Governance Analyst at Entain India, on PeerSpot, 12 December 2025

Pricing
Not published. The pricing page shows a Request pricing button in place of a figure.
Three things set the tier: named users, data objects, and active DQ configurations, meaning checks executed at least once in the past 90 days. Consumer users with view permissions are unlimited at every tier.
ONE Desktop is downloaded from Ataccama’s support service desk and needs a licence key. The minimum is 4 cores and 16 GB of RAM, with 32 GB recommended.
Bottom Line
Shortlist it when a migration or a new model depends on knowing which columns are keys and which depend on each other, and when those findings have to become governed quality rules.
The strongest relationship profiler here for anyone not already licensed for IBM, though you will be buying it without a trial.
3. Power Query: Best for Analysts Checking a Source Inside Power BI or Excel

What it does: The data preparation editor built into Power BI Desktop, Excel and Power Query Online. Its Column quality, Column distribution and Column profile views show the valid, error and empty share of each column, its distinct and unique counts, and its value distribution.
Who this is for: Business and BI analysts on Windows who already build in Power BI Desktop or Excel and want column checks on a source before they model it.
Anyone with Power BI Desktop or Excel already has this. Turn on Column quality, Column distribution and Column profile in the editor, and each column shows its valid, error and empty shares, its distinct and unique counts, and a value distribution. Right-click a value in the profile and you can filter or transform it on the spot.
Microsoft’s own documentation (updated 28 August 2025) carries the catch: “By default, Power Query performs this data profiling over the first 1,000 rows of your data.” Switch the status bar to Column profiling based on entire data set before you trust what it shows.


Key Features
- Column quality shows the valid, error and empty share under every column header
- Column distribution shows distinct and unique counts and a frequency chart
- Column profile adds column statistics and a value distribution you can group, for example by text length
Pros and Cons
Pros
- Free in Power BI Desktop and already installed for most Excel and Power BI users
- The profile sits in the same editor where the cleaning steps are written, so a finding becomes a fix in one click
- No code is needed, and users credit it with opening data transformation up to operations staff
Cons
- Power BI Desktop runs on Windows only
- It profiles one query’s columns at a time, with no key or relationship discovery across tables
- One heavy user hopes for “a better profiler and a better editor” (Hacker News, 26 July 2023)
What Users Say
Power query for Excel. It trivialized data transformation for admin/operations users, who would have spent 50x the time on a VBA solution or (more likely) not bothered.
Hjfrf on Hacker News, 16 March 2021

What holds it back most of all I feel is the prison that is the Power Query editor
RGamma on Hacker News, 26 July 2023

Pricing
Free in Power BI Desktop, which Microsoft’s Power BI pricing page lists as “available as a free download” (read 14 November 2026). The same profiling views ship inside Excel.
Cost starts when you share reports through the Power BI service: Power BI Pro is $14.00 and Premium Per User $24.00, both per user per month, paid yearly.
Power BI Desktop needs Windows 10 or Windows Server 2016 or later, with at least 2 GB of RAM available and 4 GB recommended.
Bottom Line
The quickest look at a source for anyone already building in Power BI or Excel. When the question spans tables, or the analyst works on a Mac, it runs out. For the preparation side, Power Query also appears in our data wrangling tools list.
Free for most analysts and good enough for checking one query at a time, once the 1,000-row default is switched off.
4. AWS Glue DataBrew: Best for AWS Teams That Want Profile Jobs Without Writing Code

What it does: A serverless, no-code AWS service whose profile jobs compute column statistics, value distributions, outliers, duplicate rows, correlations and optional PII detection over a dataset, then write the results to S3.
Who this is for: Data and analytics teams already running on AWS, with data in S3, who want profiling without maintaining code or servers and can pay per node-minute.
DataBrew runs a profile as a serverless job. Point one at a dataset and it works out more than 25 column statistics, value distributions, Z-score outliers, duplicate rows and a Pearson correlation matrix, with optional PII detection, and writes the results to S3.
Beyond the one comment quoted below, we found a single other public user voice: Rich Dudley, writing for AWS Community Builders in December 2020, that “One feature missing in the Profiling is determining the pattern or length of text values.” The current docs now list string-length statistics. Pattern detection is still not among the documented statistics.


Key Features
- Profile jobs with 25+ column statistics, value distributions and Z-score outlier detection
- Dataset-level duplicate row counts and a Pearson correlation matrix
- Optional PII detection across 19 entity types
Pros and Cons
Pros
- No code and no servers: point a profile job at a dataset and read the results
- Pricing is public and per minute, so a profile run can be costed before it starts
- PII detection is built into the same profile job
Cons
- AWS only: it profiles datasets you bring into DataBrew on AWS
- No cross-table key or relationship discovery, and correlation is Pearson only
- Columns of unsupported types are skipped, and dates and nested types are not on the supported list
- The public user record is thin, with no DataBrew listing of its own on G2 or PeerSpot
What Users Say
Amazon Seller Central, AWS Partner Central, and Glue Databrew are all Amazon productivity-style apps, and I hated every minute of using them.
Centigonal on Hacker News, 11 June 2026

Pricing
Profile jobs: $0.48 per node-hour, billed per minute, with 5 nodes per job by default. AWS’s own example puts a 10-minute job on 5 nodes at $0.40. Jobs get no free allowance.
Interactive sessions: $1.00 per 30-minute session. The first 40 sessions are free for first-time DataBrew users, and those free sessions do not cover profile jobs.
A job can scale to 149 nodes and times out after 48 hours by default. The rates shown are for US East (Ohio), from the AWS Glue pricing page.
Bottom Line
A sensible default when the data already sits in S3 and nobody wants to maintain profiling code. Run one small job first to see what a profile costs before you put it on a schedule.
Cheap profiling with no code for teams on AWS, backed by the thinnest user record on this list.
5. IBM InfoSphere Information Analyzer: Best for IBM Estates Mapping Referential Integrity Before a Migration

What it does: The profiling component of IBM InfoSphere Information Server. Column analysis covers content, structure and quality; key and cross-domain analysis then finds primary keys, foreign-key candidates and referential-integrity gaps between tables, and data rules validate the results.
Who this is for: Large enterprises already licensed for IBM InfoSphere Information Server, usually with legacy relational sources and a migration or consolidation ahead.
Information Analyzer starts with column analysis. Key and cross-domain analysis then finds primary keys and foreign-key candidates, and its referential-integrity analysis “evaluates whether there are gaps between the foreign keys and the primary keys in your data”, according to an IBM support article last modified in June 2018.
It is still supported: an IBM security bulletin of 28 September 2026 lists Information Server 11.7. But a 2023 IBM community blog encourages Information Server clients to consider IBM Knowledge Catalog, whose product page now redirects to watsonx.data intelligence.

Key Features
- Column analysis for content, structure and quality
- Primary-key analysis and foreign-key candidate discovery across tables
- Referential-integrity analysis for gaps between foreign and primary keys
Pros and Cons
Pros
- Key and cross-domain analysis finds foreign-key candidates and orphaned keys, the checks a migration depends on
- Reviewers rate its profiling and data discovery well
- Still a supported IBM product: 11.7 appears in a September 2026 security bulletin
Cons
- No public price, and PeerSpot reviewers describe it as sold in a bundle with other IBM products
- Reviewers report a complex setup, and a Tata Consultancy Services team lead wrote that its latest version “has some stability issues” (PeerSpot, 3 August 2022)
- IBM is steering Information Server clients toward its newer catalog platform
- The review base is small and ageing: six PeerSpot reviews, several of them from 2014 to 2022
What Users Say
The initial setup was complex and not very intuitive.
reviewer1959495, Infosphere Consultant at an insurance company with 1,001-5,000 employees, on PeerSpot, 16 December 2022

IA is good at data profiling / data discovery.
Todd Ramirez, Data Quality Consultant at USAA, on PeerSpot, 16 December 2025

Pricing
Not published. IBM’s product page shows no price, plan or tier. Book a meeting and Contact us are the only ways in.
Because PeerSpot reviewers describe it as part of an IBM bundle, an existing InfoSphere customer should first ask what the current entitlement already covers.
Bottom Line
For an InfoSphere estate facing a migration, its key and referential-integrity analysis is the check that matters. Its analysis exports only to IBM InfoSphere Optim and Guardium.
Worth running where InfoSphere is already paid for, and a poor choice for starting a new estate.
6. OpenRefine: Best for One Person With One Messy File

What it does: A free, open-source desktop tool that runs as a local web server and lets one person explore and clean a messy file with facets (value counts, numeric histograms, blanks) and clustering of near-duplicate values.
Who this is for: Individual analysts, researchers and consultants cleaning exported spreadsheets and CSVs on their own machine, for example before a small migration.
Fivetran’s profiling guide (August 2025) is candid about it: “It’s not exactly a data profiling tool, but it offers free data profiling features.” The feature in question is the facet. A text facet lists every distinct value in a column with its count, and a numeric facet draws a histogram you can filter on.
Clustering then groups near-duplicate spellings so you can merge them, catching variants that column statistics miss. Everything runs as a small web server on your own computer, so the file stays with you. For the cleaning side, OpenRefine also appears in our data wrangling tools list.


Key Features
- Text facets list every distinct value in a column with its count
- Numeric facets show a histogram you can filter on
- Clustering of near-duplicate spellings, run locally on Windows, Mac or Linux
Pros and Cons
Pros
- Free, open source and still released, with 3.10.1 out in March 2026
- Facets show the real spread of values in a column within seconds, with no code
- It runs on your own machine, so the file never leaves it
Cons
- It defaults to 1 GB of memory, and the docs treat anything over a million cells or 50 MB as large
- Single-user: sharing work means passing the project file around
- There is no column statistics report and no cross-table key discovery
- It works on files you load into it, so warehouse tables are out of reach
What Users Say
OpenRefine was absolutely instrumental in cleaning up lots of disparate data when the data sources were too many and too variable to make a scripted solution valuable.
cdcarter on Hacker News, 22 October 2023From a comment about data consolidation and migrations for small nonprofits.

I loaded a 10k entity subset of this and OpenRefine found all of the duplicates I had manually found plus others that I guess were ‘similar’. Really cool, but it crashed when attempting to merge entities together.
arrowleaf on Hacker News, 23 October 2023The data was RDF: a 10k-entity subset of about 50 million URIs.

Pricing
Free. Open source under the BSD-3-Clause licence. The current release, 3.10.1, came out on 4 March 2026.
It runs on Windows, Mac and Linux and needs Java, which comes bundled on Mac and Windows. The installation guide sets the default memory at 1 GB.
Bottom Line
Use it for an exported spreadsheet or CSV that one person has to understand and clean. Shared projects and warehouse-sized data belong elsewhere.
The free way to see what is really in one messy file; past a million cells, its own docs call the data large.
Which Data Profiling Tool Should You Choose?
Two questions settle most of this list before price comes into it: where the data sits, and whether you need to see across tables.
If the profile is the first step of a migration, most of the effort comes afterwards, in deciding what to fix, what to drop and what has to match once the move is done.
| Your situation | Start with | Why |
|---|---|---|
| A table or file you can load into Python | ydata-profiling (fg-data-profiling) | Free, and one call gives a full column report |
| Key, foreign-key and dependency discovery, and you are not already on IBM | Ataccama ONE | ONE Desktop documents all three; IBM documents the first two |
| A source you are about to load into Power BI or Excel | Power Query | Already installed; switch it to the entire data set |
| Data in S3 and no appetite for profiling code | AWS Glue DataBrew | Serverless jobs with a published per-minute rate |
| Already licensed for InfoSphere Information Server, with a migration ahead | IBM InfoSphere Information Analyzer | Referential-integrity analysis you may already own |
| One exported spreadsheet or CSV on your own machine | OpenRefine | Facets and clustering, free, with nothing uploaded |
Skip this category entirely if:
- The profile is done and what you need now is checks on every load. That is data quality testing, compared in our data quality tools post.
- Nobody will act on what the profile finds.
- You meant a code profiler. Those measure how fast software runs, and none of these tools does that.
What’s the Best Data Profiling Tool in 2026?
For most teams, fg-data-profiling, the library people still search for as ydata-profiling. It costs nothing, and one call returns a column-by-column report, which is further than anything else here gets you in the same time.
When the question is how tables relate, Ataccama ONE. Relationship profiling is what a migration or a new model depends on, and only Ataccama and IBM document it. IBM’s Information Analyzer makes sense where InfoSphere is already licensed; everyone else should ask Ataccama for a quote.
Analysts already working in Power BI or Excel should try Power Query before installing anything. AWS teams that want a schedule and no code have DataBrew, and OpenRefine covers the job of one person with one file.
From Profile to Production: Where Algoscale Comes In
A profile hands you a list of questions. Which of these nulls are real? Is this column a key, or only unique in this extract? Somebody has to answer them before a migration can be planned or a model built, and none of the tools above does that part.
That is the work our data management team does: turning what a profile finds into migration rules, model decisions and the checks that guard them. This post’s author, Neeraj Agarwal, has 16+ years in data engineering and analytics and has led enterprise data warehouse and lakehouse builds for retail, fintech and manufacturing clients including Walmart and Capital One.
- Profiling the sources a migration or model depends on, with the tool you already have
- Sorting the findings into the ones that block the work and the ones that can wait
- Writing the keys, mappings and rules the profile points to
- Handing over checks that run on every load, so nobody has to repeat the profile by hand
Ready to put this into production?
Algoscale’s data engineers have built and migrated data platforms for retail, fintech and manufacturing teams. Book a free consultation and we will scope yours with you.
Frequently Asked Questions
What are the tools used for data profiling?
The six data profiling software options compared here are ydata-profiling (now published as fg-data-profiling), Ataccama ONE, Power Query, AWS Glue DataBrew, IBM InfoSphere Information Analyzer and OpenRefine. Three are free: ydata-profiling for Python dataframes, Power Query inside Power BI Desktop and Excel, and OpenRefine for single files. DataBrew is billed per node-hour on AWS, and Ataccama and IBM are sold by quote. Of the six, only Ataccama, in its ONE Desktop client, and IBM document key and foreign-key discovery across tables.
What is data profiling?
Data profiling means examining a dataset to find out what is actually in it before you rely on it. It usually covers three things: structure (types, formats and lengths), content (nulls, distinct values, distributions and outliers) and relationships (which columns could be primary or foreign keys, and where joins would break). Teams profile before a migration, a data model or a set of quality rules. Data quality testing is the later step, checking the same data again on every load.
Is there a free data profiling tool?
Yes, three on this list. fg-data-profiling, formerly ydata-profiling, is free under the MIT licence and installs with pip. OpenRefine is open source under BSD-3-Clause and runs on your own machine. Power Query’s profiling views are free in Power BI Desktop, a free Windows download, and also ship inside Excel. AWS Glue DataBrew gives first-time users 40 free interactive sessions, but its profile jobs are always billed, at $0.48 per node-hour.
How do you profile data in Power BI?
In Power Query Editor, turn on the Column quality, Column distribution and Column profile views. Each column then shows its valid, error and empty shares, its distinct and unique counts, and a value distribution you can group. By default Power Query profiles only the first 1,000 rows, so switch the status bar setting to Column profiling based on entire data set before trusting the numbers. Profiling in Power BI Desktop is free; sharing reports through the Power BI service starts at Power BI Pro, $14.00 per user per month, paid yearly.