




Almost every tool in this category has a free tier, and almost none of them mean the same thing by it. One lets you publish unlimited charts to the public web for nothing. One lets you author locally and share with no one. One is free in the library and billed in the cloud. One is free only if your use is non-commercial.
So the useful question is not which data visualization tools are free. It is what each free tier actually lets you ship – and that is the column this comparison carries that no rival page has.
One omission is deliberate. Power BI is not here, and neither are Qlik, Sisense or Looker. Those are BI platforms, where the argument is governance and seat economics, and we rank them in our business intelligence tools comparison – with the switching case in our Power BI alternatives round-up. This page is about the chart layer: the tools whose job is the picture. Tableau appears in both because it genuinely is both.
Every price and limit below was read on the vendor’s own page on 8 November 2026. Nothing was trialled and no account was created.
7 Best Data Visualization Tools: Quick Comparison
| Tool | Best For | Public Reviews | The Catch | Starting Price | What The Free Tier Publishes | Access |
|---|---|---|---|---|---|---|
| 1Tableau | Interrogating a dataset chart by chart, changing the question as you go | TrustRadius – 8.6 from 2,338 ratings, the largest corpus here; criticised on large-dataset performance | Half of its recent reviewers report performance degradation on large datasets | From $15 a user a month, billed annually; Enterprise from $35 | Tableau Public publishes to the open web, public data only; Desktop Free Edition is local with no sharing | Two free routes, no card |
| 2Datawrapper | Publishing a chart today that has to be accessible and legible on a phone | G2 – 4.3 from 10 reviews; praised for chart range, criticised on large datasets | No data-warehouse connection, by its own reviewers’ account | Free / $21 / $39 per user a month excl. VAT | Unlimited published charts, maps and tables with PNG download – PDF and SVG are not included | Free plan, no card |
| 3Algoscale | When the dashboard is bought and the numbers in it still cannot be trusted | Our own case study – report preparation cut from 10-14 days to real-time, 90% less manual effort | A services engagement, so there is nothing to download | Not published – scoped per engagement | Not applicable – we build the layer the tools read from | Talk to us |
| 4Plotly | Analysts already living in Python or R who want the chart interactive | G2 – 4.8 from 36 reviews, but the listing reviews Dash Enterprise, not the library | One name covers a free library, a metered cloud and a quote-only platform | Library free (MIT); Plotly Cloud $0 / $29 a Creator seat a month | The open-source library and a standalone HTML file you own; Cloud free gives 1 Creator seat and 3 private viewers | pip install, no account |
| 5Flourish | A story that has to move – animated, scrolling, presented rather than queried | G2 – 4.7 from 5 reviews; the thinnest corpus here | The cheapest paid tier is a Canva subscription, not a Flourish plan | Not published on any paid tier | Unlimited published projects and the full template range, with attribution – and no export at all | Free plan, no card |
| 6Highcharts | Charts shipped inside your own product, under a licence legal can read | G2 – current reviews from September and October 2026; the recurring complaint is licence cost | OEM, Orbit and teams over six seats all go back to a quote | 366 USD per developer seat for Core, add-ons on top | Nothing commercial – non-commercial use sits under separate terms | Buy a seat in the web shop |
| 7D3.js | A visualization no chart library ships, built by someone who writes JavaScript | G2 – 4.2 from 20 reviews as D3.js By Observable; the complaint is always the learning curve | Its own maintainers steer most people to a simpler library | $0, ISC licence, no paid tier | Everything – use, copy, modify and distribute for any purpose, with or without fee | npm install, no account |
Not sure which of these fits your stack?
Tell us what you are running today and what you need it to do. We will tell you which of these we would pick, and why. We are not going to pitch you.
How We Researched These Data Visualization Tools
Nothing was trialled and no account was created. Every price, limit and licence term below was read on the vendor’s own pricing, licence or documentation page on 8 November 2026. Tableau, Datawrapper and Flourish all require an account to open their editors, so there is no screenshot of a logged-in session anywhere in this post – a product tour we did not take is not evidence we can offer you.
Open source and commercial are kept strictly apart. Plotly in particular is two things under one name: the MIT-licensed Python library is free, Plotly Cloud charges $29 a Creator seat, and Dash Enterprise publishes nothing. No free project’s licence is quoted against a paid product’s price anywhere here, in either direction.
Review corpora in this category are small, and we say so per entry rather than averaging the problem away. Flourish has five reviews. Datawrapper has ten, and none on TrustRadius. D3’s TrustRadius bodies stop in 2019, so the current evidence comes from its G2 listing instead. Only Tableau has a corpus large enough to argue with.
Three sources could not be read and nothing was worked around to reach them. Reddit now requires a login on both its current and legacy sites, and Capterra and SourceForge sit behind a bot check, so no evidence from any of the three appears below.
Four things decided the order:
- What the free tier actually publishes – free authoring is common in this category and free publishing is rare, and the gap between them is where most shortlists go wrong
- Who has to build the chart – a browser editor, a Python notebook and a JavaScript library are three different hiring decisions long before they are three different budgets
- Whether the licence survives contact with your lawyer – a chart shipped inside a product you sell is a different licence from a chart on your own intranet, and only one entry here prices that distinction
- What happens to the picture on a phone and in a screen reader – most published charts are read on a handset, and accessibility is either a default or a project – the entries differ sharply on which
Chart Editor, Chart Library, or Something Underneath?
This category contains three different products wearing one label. Find your sentence on the left before comparing anything.
The last two rows are not solved by any tool on this page.
| What you are actually trying to do | What to reach for | Why |
|---|---|---|
| Publish a chart to a public audience, today, with no developer | A browser chart editor | Datawrapper and Flourish both publish free, and both handle phones and screen readers for you |
| Explore a dataset yourself, changing the question as the picture changes | An analyst workbench | That is Tableau’s loop, and both of its free routes let you test it before buying a seat |
| Put a chart inside software you sell to customers | A commercial chart library | Highcharts prices that case explicitly – Internal, SaaS and OEM are three different licences |
| Draw something no chart library ships | A low-level library | D3 is free and total control, and its own maintainers say most people should not be here |
| The chart is fine but the numbers in it are wrong or two weeks old | Fix the model underneath | No editor or library validates its input – this is the row we are in, at number three |
| Everyone keeps rebuilding the same chart in a different tool | None of the above | That is a definitions problem, and a seventh tool will produce an eighth version of the number |
- If you are in the first four rows, the comparison above is your shortlist, and the free column is the fastest way to narrow it.
- If it is in the last two, the fix is upstream of the picture – start at entry 3.
1. Tableau: Best for Interrogating a Dataset Chart by Chart
What it does: Desktop and browser authoring for visual analysis: connect a source, drag fields onto a canvas, and change the question as the picture changes, then publish to Tableau Cloud, Tableau Server or Tableau Public.
Who this is for: Mid-market to enterprise analytics teams with named analysts doing the authoring
Drag a field, look at the picture, ask a different question. That loop is Tableau’s real product, and nothing else here is built for the back-and-forth, which is why it survives in teams that could technically do the job in a notebook.
You can test that loop without buying anything. Desktop Free Edition authors locally against Excel, CSV and databases with no sharing at all; Tableau Public publishes to the open web on the condition that your data is public and your refresh is limited.


Key Features
- Browser-based web authoring plus Tableau Desktop and Prep Builder, all inside the entry Standard edition
- Connections to Excel, text files, relational databases and cloud sources including Salesforce
- Interactive dashboards assembled from individual sheets, with filters shared across them
- Two free routes in: Tableau Public on the web and Desktop Free Edition locally
Pros and Cons
Pros
- Two genuinely free routes in, so the authoring loop can be tested before a seat is bought
- Reviewers consistently name breadth of data connectivity and the speed of a first chart as the reasons they stay
- The entry Standard edition already bundles Desktop, Prep Builder and web authoring rather than selling them as upgrades
- The review corpus is the largest of any entry here, so the complaints are unusually well evidenced
Cons
- Half of TrustRadius’s recent reviewers report performance degradation on large datasets
- A reviewer warns the live connection is not actually that live, and that it created misunderstandings on her team
- Another reports it is clunky connecting to Python or R via scripts, with less depth for advanced statistical analysis
- Priced per user on an annual contract with at least one Creator licence per deployment, and the top tiers are quote-only
What Users Say
Tableau Desktop build-in features is best to create interactive dashboards.
Manidipa Kundu on TrustRadius

Live connection is not actually that live – one needs to pay more attention to this because it created misunderstandings.
Jannika Rasi on TrustRadius

Pricing
Tableau Standard on Tableau Cloud: from $15 USD per user a month, billed annually.
Tableau Enterprise: from $35 USD per user a month, billed annually, adding Advanced Management and Data Management.
Tableau Cloud+ and the Tableau+ Bundle are both Contact Sales, with no public figure.
The page’s own condition: this solution requires an annual contract, and every deployment requires at least one Creator licence. We work the per-seat maths and the Power BI comparison through in our Power BI vs Tableau breakdown.
Free routes: Tableau Public is a free platform for public – not private – data, where published visualizations are visible to anyone and data refresh is limited. Tableau Desktop Free Edition analyses Excel, CSV and database files locally with full authoring and no sharing.
Bottom Line
Prove the loop on Tableau Public or Desktop Free Edition first. If your analysts use it daily the seat pays for itself; if they do not, nothing here will fix that.
The analyst’s workbench, with two free ways to find out if you need it.
2. Datawrapper: Best for Publishing a Chart That Has to Be Right
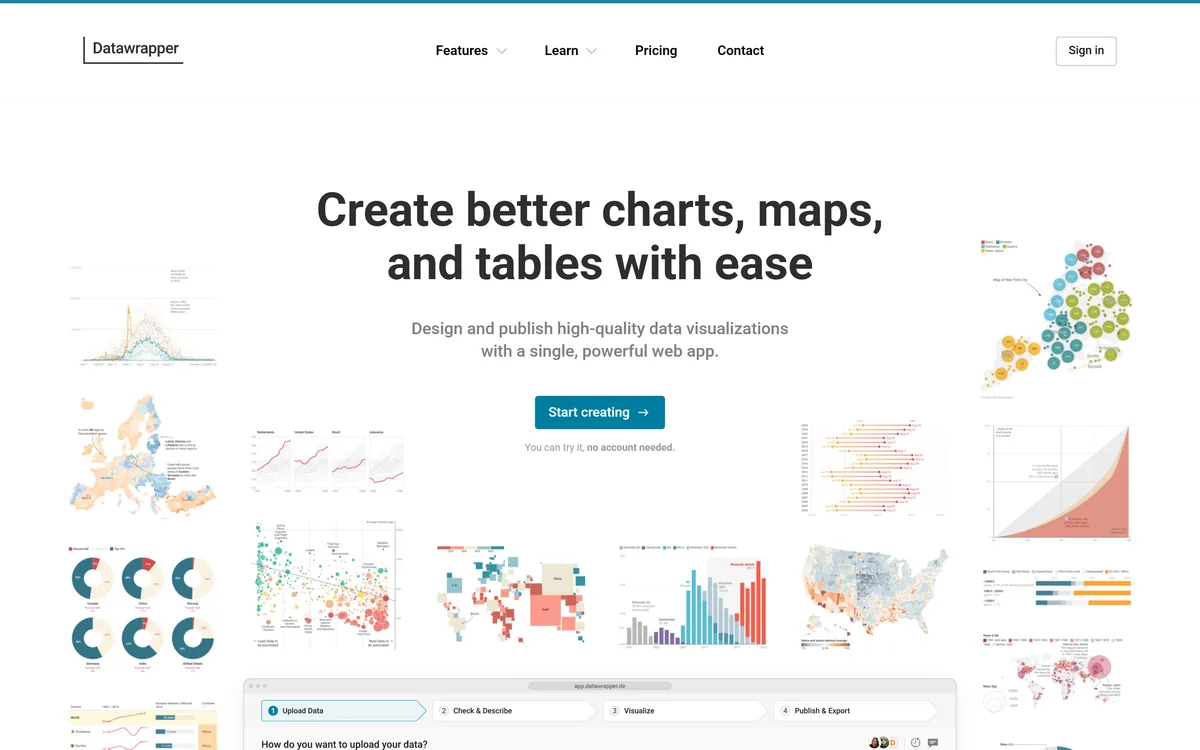
What it does: A browser chart editor built for publishing: paste or upload a table, pick one of 23 chart types, and get an embed that is responsive, keyboard-navigable and readable by a screen reader without configuring any of it.
Who this is for: Newsrooms, comms, research and analyst teams publishing charts to a public audience
Datawrapper is the only entry here where accessibility and mobile behaviour are defaults rather than settings. Labels collapse into a colour legend on small screens, every element is keyboard-navigable, screen readers get a description, and a colourblind check warns you on the chart as you build it.
The free plan is a real publishing tier, not a trial: unlimited charts, maps and tables published to the web with PNG download. What it withholds is PDF and SVG export, which start at Pro.


Key Features
- 23 chart types, plus maps and searchable tables, in a single browser editor
- Automatic responsive behaviour: labels collapse into a colour legend on small screens
- Keyboard navigation of every chart element and screen-reader descriptions, with author-set alt text
- An automatic colourblind check that raises a warning on the chart being built
Pros and Cons
Pros
- The Free plan is a real publishing tier rather than a trial – unlimited published charts, maps and tables with PNG download
- A colourblind check runs on the chart as you build it, and raises a warning before you publish rather than after
- A reviewer singles out its array of advanced chart options that are challenging to create elsewhere, including searchable tables
- Every price except Enterprise is printed on the pricing page, including the per-operation API rates
Cons
- A reviewer reports it cannot handle large datasets effectively, with delays creating visuals, and that it does not connect to data warehouses
- A second reviewer hits the same wall on large uploads and finds the interface plain
- PDF and SVG export and removing the Datawrapper credit all require Pro, and waterfall and dual-axis charts require Business
- Brand consistency is expensive: a custom theme is $499 a month on top of the seats, and $299 a month for each extra theme
What Users Say
One limitation is its inability to handle large datasets effectively, resulting in delays when creating visuals. Furthermore, it does not have the ability to connect with data warehouses.
Anjani T. on G2

The best thing which I like about Datawrapper is that I can easily create charts and maps with so much ease. It makes my data so much easy to understand and read.
Amit K. on G2

Pricing
Free: no charge, and it publishes. Interactive charts, maps and tables created and embedded, published on the web, with PNG download and 30 days of edit history.
Pro: $21 per user a month excluding VAT. Business: $39 per user a month excluding VAT. The page carries a monthly/annual toggle but prints a single figure per plan, so check which term you are being quoted before you commit.
Enterprise: Contact us, with no published figure.
Custom theme is an upgrade at +$499 a month excluding VAT, and $299 a month for every additional theme.
The REST API is credit-billed beyond included volumes: Create is free to 500 operations a month then $0.04 each, Publish free to 1,000 then $0.02.
Bottom Line
The fastest route from a table to a chart you are not embarrassed to publish. Check whether you need PDF or SVG before you assume the free tier is enough.
The free tier publishes for real, which almost nothing else here does.
3. Algoscale: Best When the Chart Is Right and the Numbers Are Not
What it does: Algoscale is the data engineering team that implements the tools on this list. We model the data underneath the charts, build the pipelines that keep them current, and wire the access controls that decide who sees which rows.
Who this is for: Teams that have already bought the visualization layer and cannot get trustworthy numbers into it
Every tool above draws what it is given. When a chart is correct but two weeks stale, or when the same report says different things to different people, the problem is upstream of the chart and no amount of template choice reaches it.
A Toronto-based provider of cloud based employee engagement solutions was preparing reports by downloading and cleaning Salesforce data by hand, up to two weeks per cycle. We built a unified data model and automated the extraction straight into Tableau.


Key Features
- A unified data model that consolidates and normalises the source objects before anything is charted
- Automated extraction and integration pipelines that keep a dashboard current instead of refreshed by hand
- Role-based filtering so one dashboard shows each viewer only the rows they are allowed to see
- Pipelines designed to take additional sources later, not rebuilt each time one is added
Pros and Cons
Pros
- We work on the layer that actually breaks: on the Salesforce-to-Tableau engagement the fix was a unified data model, not a different chart tool
- The access-control question is answered in the pipeline, with role-based filtering rather than duplicated dashboards
- The engagement is documented end to end with its own numbers – 10 to 14 days of manual report preparation replaced by real-time updates
- Platform-agnostic on the warehouse side: AWS, Azure and Google Cloud, Databricks, Snowflake, Microsoft Fabric, dbt and Airflow
Cons
- Algoscale is a services team, not software: there is nothing to download, trial or compare feature by feature against the other six
- No price is published – every engagement is scoped on a call, so you cannot budget from a pricing page the way you can with Datawrapper or Highcharts
- There is no self-serve route: a small team that only needs one chart published this week is better served by a tool on this list
- The results quoted are from one engagement and are our own reporting of it, not an independently audited benchmark
What Users Say
Reduced report preparation time from 10-14 days to real-time updates, cutting manual effort by 90%.
Algoscale case study: real-time Salesforce analyticsPublished case study, quoted from the live page. The client cannot be named beyond “a Toronto-based employee engagement provider”. This is Algoscale’s own reporting of its own engagement, not a third-party review, and the entry says so.

Pricing
Not published. No price appears on our service pages; engagements are scoped per project on a call. Flourish and Dash Enterprise answer the same way.
The engagement is the model, the pipeline and the access control – the visualization licence stays yours to buy.
No per-seat licence on the result, so the work does not cost more as more people read the dashboard.
The data engineering service spans architecture and strategy, ingestion and integration, adaptive pipeline engineering, cloud storage and lakehouses, and warehouse engineering.
Platforms we work across include AWS, Azure and Google Cloud, with Databricks, Snowflake, Microsoft Fabric, dbt and Airflow.
Bottom Line
Call us when the tool is bought and the dashboard is still wrong. Not when you need one chart published this week – something above will do that faster.
The fix when the chart is fine and its input is not.
4. Plotly: Best for Analysts Who Already Live in Python
What it does: Two things under one name. The open-source plotly libraries for Python, R and JavaScript draw interactive charts inside a notebook or a standalone HTML file with no account. Plotly Cloud, Plotly Studio and Dash Enterprise are the paid products that host and share those charts as apps.
Who this is for: Python and R analytics and data-science teams
If your analysts already write Python, Plotly removes the procurement step entirely: pip install, and the chart is interactive inside the notebook. It is MIT-licensed, supports over 40 chart types, and saves to a standalone HTML file you own outright.
The confusion is the name. Plotly Cloud charges $29 a Creator seat a month, Dash Enterprise publishes no figure at all, and the pricing pages never mention that the libraries are free. Three products, one brand, and only one of them costs nothing.


Key Features
- Over 40 chart types in the open-source Python library, including statistical, financial, geographic, scientific and 3D marks
- Installs with pip or conda, with no account and no licence negotiation
- Charts render interactive inside Jupyter and save to a standalone HTML file
- Plotly Express as the high-level API over the same figure objects
Pros and Cons
Pros
- The library itself is free and MIT-licensed, so there is no procurement step between an analyst and an interactive chart
- A reviewer names the reason to pick it: being built on Python means using the Python skills you already have
- The chart stays interactive in the notebook and in a standalone HTML file, so sharing it does not require the paid platform
- Plotly Cloud’s seat price is published, including the viewer-seat and credit add-ons, which is rare for a hosted analytics product
Cons
- A reviewer finds the layout restrictive, and that it is not always straightforward to get the exact look wanted for a web app
- Dash Enterprise publishes no price whatsoever, so the enterprise end of the product is unbudgetable from the website
- One name covers a free library, a credit-metered cloud and a quote-only platform, and the pricing pages do not say the libraries are free
- The independent review corpus describes Dash Enterprise, not the plotting library most readers mean by Plotly
What Users Say
Dash makes it simple to build beautiful visualization.
Maria F. on G2 (Plotly Dash Enterprise listing)

While I enjoy using Dash, I do find that the layout can be a bit restrictive at times. It’s not always straightforward to achieve the exact look I want for my web apps, especially when I’m aiming for a very specific design.
Uttam M. on G2 (Plotly Dash Enterprise listing)

Pricing
The open-source library is free, under the MIT licence. pip install, no account, over 40 chart types.
Plotly Cloud and Plotly Studio: Free at $0 with no credit card – a 10-credit trial, 1 Creator seat, 3 private viewers and 10 apps.
Pro: $29 per Creator seat a month, or $290 a year. It includes 30 credits monthly, 1 Creator seat and 10 private viewers; extra viewer seats are $10 a month and extra credits $1 each.
Dash Enterprise: not published. Plotly’s quote-request page carries no figure for any tier and never names Dash Enterprise on it.
Keep the two apart when budgeting: the MIT library and the Creator seat are different products that happen to share a brand.
Bottom Line
Free is the right answer until apps need private viewers. Price Plotly Cloud only at that point, and expect a quote rather than a price above it.
Free where most teams will stay, and metered the moment you leave the notebook.
5. Flourish: Best for a Data Story That Has to Move
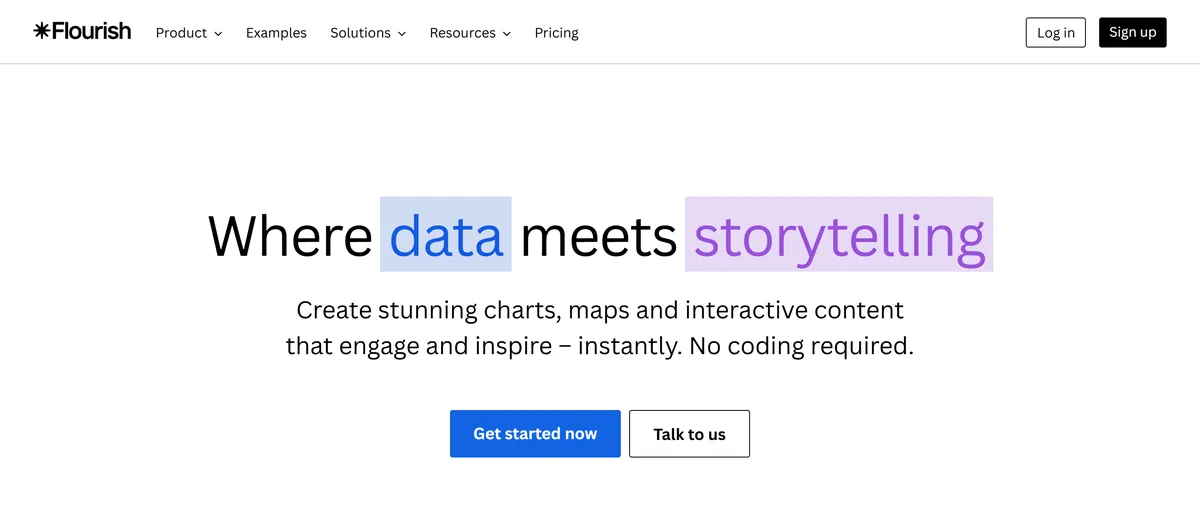
What it does: A template-driven studio for data stories: pick one of 50-plus chart, map and interactive templates, point it at a table, and publish an animated or scrolling piece an audience is walked through rather than asked to query. Owned by Canva.
Who this is for: Comms, marketing, newsroom and public-sector teams presenting data stories
Animation and scrollytelling are templates here rather than something you assemble yourself. If the deliverable is a piece an audience is walked through, this is the shortest route to it, and the free plan publishes unlimited projects with the full template range.
Budgeting is the problem. Not one paid tier publishes a price. Presenter is not even a Flourish plan – it arrives with a Canva Business or Enterprise subscription, so the conversation moves to Canva’s price list rather than this one.


Key Features
- Over 50 chart, map and interactive-content templates, all available on the free plan
- Scrollytelling for narrative pieces, on Publisher and above
- Live data updates from Google Sheets or CSV, on Publisher and above
- Full privacy for unpublished projects and their data, including on the free plan
Pros and Cons
Pros
- The free plan publishes unlimited projects with the full template range, so animated and scrolling formats ship at no cost with attribution
- A reviewer describes the payoff directly: interactive charts that enhance readability even for complicated charts
- The template library covers the moving formats outright – animated charts, scrollytelling, interactive maps – with no assembly
- Unpublished projects and their data stay private even on the free tier, which matters for embargoed numbers
Cons
- Not one paid tier publishes a price – Presenter is Get via Canva, Publisher and Enterprise are Get in touch, and the FAQ only mentions custom contracts
- The cheapest paid route is not a Flourish plan at all: Presenter requires a Canva Business or Enterprise subscription
- A reviewer says it should be more flexible when it comes to customizing the layout
- The review corpus is the thinnest of any entry: 5 reviews on G2 and no TrustRadius listing at all
What Users Say
I appreciate Flourish for creating interactive charts for webpages because it enhances readability even for complicated charts, allowing readers to interact and engage more deeply, leading to a better understanding.
Ann M. on G2

It should be more flexible when it comes to customizing the layout.
Alberto A. on G2

Pricing
Free: no charge, and it publishes. Unlimited projects including visualizations and stories, the full range of templates, full privacy for unpublished work, and published projects carrying Flourish attribution.
Presenter: no price published. It is Get via Canva, available with a Canva Business or Enterprise plan – so the cheapest paid tier is bought from Canva, not from Flourish.
Publisher and Enterprise: no price published. Both are Get in touch; the FAQ says premium plans are handled through custom contracts and invoicing.
Publisher adds scrollytelling, a custom theme, live data updates from Google Sheets or CSV, and HTML export for self-hosting.
Export is the free tier’s real limit: the comparison table lists Image for Presenter, Image and HTML for Publisher, and Image, HTML and Video for Enterprise, with no export option on Free – though the Presenter plan card higher up the same page says image and SVG export, so confirm before you budget on it.
Bottom Line
Build the moving piece on the free plan first. The paid tiers are unpriced, and the cheapest one is really a Canva subscription.
Generous where it is free, and completely silent about what it costs.
6. Highcharts: Best for Charts You Ship Inside Your Own Product
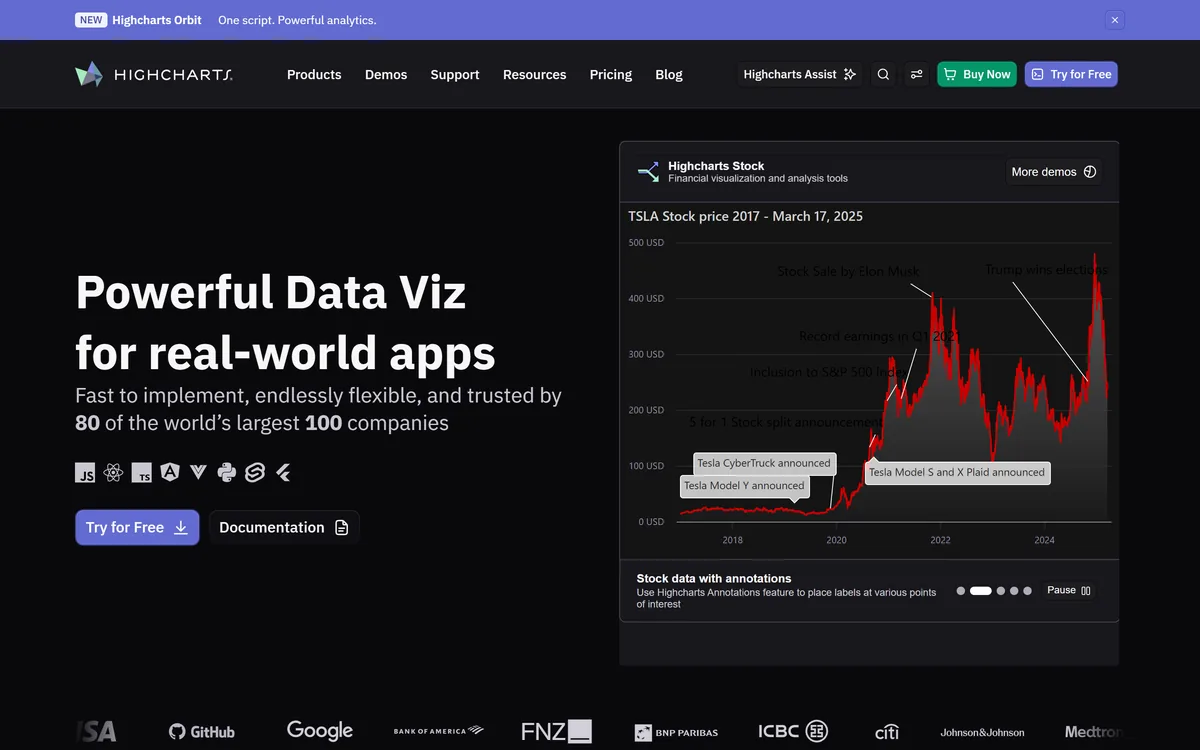
What it does: A commercial JavaScript charting library you install with npm and ship inside your own application, sold as a per-developer-seat annual subscription with the seat price printed in a public web shop and separate licence scopes for internal, SaaS and OEM distribution.
Who this is for: Product and engineering teams embedding charts in commercial software
Highcharts prices the case the others dodge: a chart that ships inside software you sell. It carries three licence scopes – Internal for your own servers, SaaS for one external application, OEM when customers receive or host the product.
Core is 366 USD a developer seat, printed in a public configurator, which is the exception in commercial charting rather than the rule. The add-ons compound it: Stock is another 366, Maps 128, Gantt 73, all per seat.


Key Features
- Per-developer-seat annual licence with the Core seat price published in a public configurator
- Three licence scopes – Internal, SaaS and OEM – that map to how the chart reaches end users
- An accessibility module included with the licence, covering screen-reader descriptions, ARIA attributes and keyboard navigation against WCAG 2.2
- Installs with npm install highcharts, with documented integrations for React, TypeScript, Angular, Vue, Flutter, Node.js, Python and Svelte
Pros and Cons
Pros
- The price is on the page – 366 USD per seat for Core – which is the exception in commercial charting, not the rule
- A reviewer names flexibility, charting breadth and documentation together as what keeps him on it
- Accessibility is licensed with the product rather than sold as an add-on, and the docs name WCAG 2.2 as the standard
- Still actively shipped: the public changelog’s latest entry is v13.1.1 on 20 September 2026
Cons
- A reviewer is blunt about the trade: the main downside is its licensing cost, especially for commercial projects and smaller businesses
- The published prices stop where many real deployments start – OEM is quote-only, Orbit is sales-only, and more than six developer seats is custom-priced
- Add-ons compound the seat cost: Core plus Stock plus Maps is 366 + 366 + 128 USD per seat before any support upgrade
- The accessibility module is not loaded by default, so an out-of-the-box chart reaches a screen reader as an image with only a title
What Users Say
Highcharts has added a lot of new features lately. One of the most exciting ones is light/dark theme support through their design system.
Ravi K. on G2

The main downside of Highcharts is its licensing cost, especially for commercial projects and smaller businesses.
Malay L. on G2

Pricing
Highcharts Core: 366 USD per seat in the public web shop configurator.
Add-ons, per seat: Stock +366 USD, Maps +128 USD, Gantt +73 USD. Highcharts for Python is +110 USD a year. Dashboards is 264 USD and Grid Pro 316 USD per seat as separate products.
Three licence scopes: Internal covers internal applications and private websites on servers you control and does not authorize use on public websites; SaaS builds on it and adds one External Application; OEM is required when you use Highcharts in a product distributed to or hosted by your customers.
What is not priced: the OEM licence is Contact our sales team for a quote, Highcharts Orbit is sold through the sales team and is not in the configurator, teams above six developer seats get custom pricing, and neither Advantage Plus support nor the Perpetual term shows a figure.
Advantage support is included by default – 10 support hours per developer and a 36-hour initial response time – and non-commercial use sits under separate terms rather than the Standard License Agreement.
Bottom Line
Price Core plus the add-ons you need, and get OEM quoted early if your customers will host the product.
The only entry here that prices the licence question properly.
7. D3.js: Best for a Visualization No Library Ships
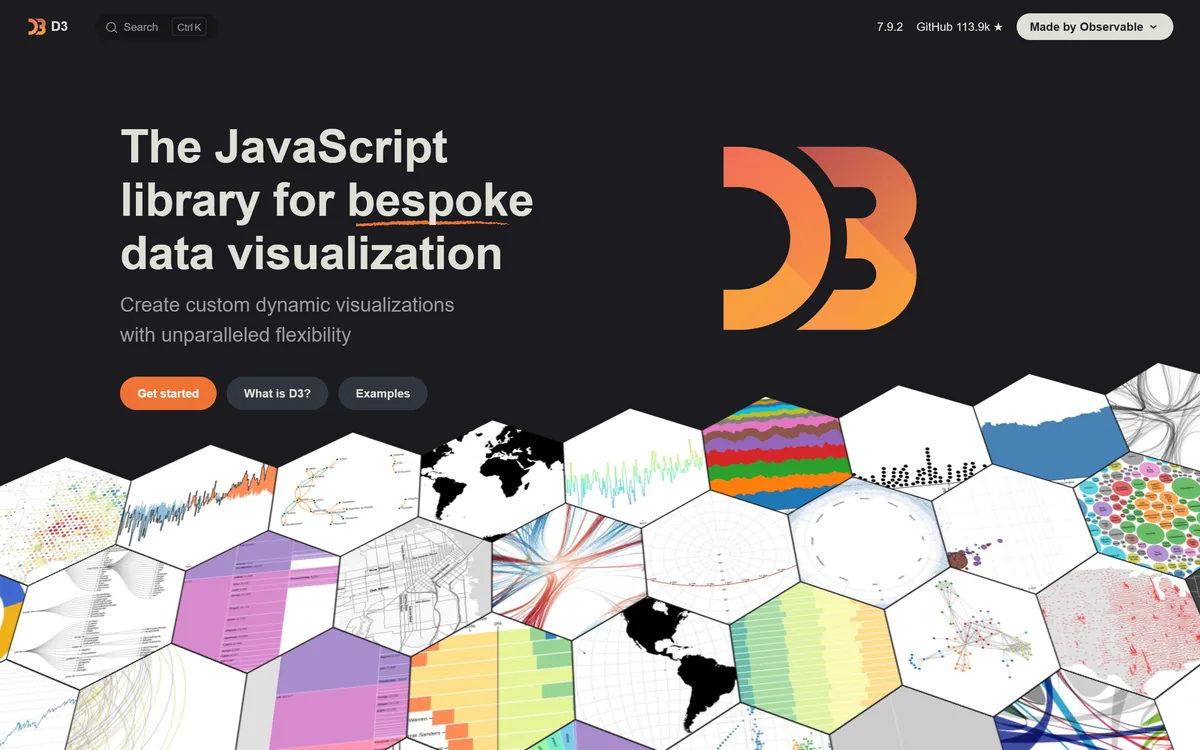
What it does: A free, low-level JavaScript library for building visualizations directly against web standards. It has no concept of a chart: you compose scales, shapes, selections and transitions yourself and render them to SVG or Canvas.
Who this is for: Front-end and data-visualization engineers inside product teams, not business analysts
D3 sits at the floor of this category. It is free under ISC, has no paid tier and no licence scope to argue about, and still ships – v7.9.2 landed on 3 November 2026. In exchange it gives you no charts at all.
Its own maintainers tell most people not to use it, recommending a higher-level library unless you need D3’s low-level control. Reviewers put it more plainly: even a simple chart means thinking about scales, domains, ranges, axes and a lot of maths.


Key Features
- A suite of 30 discrete modules – scales, shapes, selections, transitions, geo, chromatic schemes – bundled for convenience
- Renders directly to SVG and Canvas with no intermediate graphical representation of its own
- Data-driven transitions and animation as first-class primitives
- Free under ISC with no licence negotiation, seat count or commercial tier
Pros and Cons
Pros
- Total control when the visualization you need does not exist as a template – one 2026 reviewer calls it the complete freedom it gives you
- Free under ISC, so there is no procurement, no seat count and no licence scope to argue about
- Still maintained and shipping, which is not true of every long-standing chart library
- A large community and a deep example corpus – one reviewer notes the examples are detailed and easy to understand
Cons
- The learning curve is the dominant complaint: a September 2026 reviewer says even a simple chart means thinking about scales, domains, ranges, axes and a lot of maths
- There is no default chart, so accessibility, responsive behaviour, legends and tooltips are all yours to build
- The maintainers steer most people away from it, recommending a higher-level library unless you need the low-level control
- TrustRadius reviewers report it is slow with really large datasets and not great for making maps
What Users Say
The biggest downside is that D3 is really hard to learn. It’s intense, and even a simple chart means thinking about scales, domains, ranges, axes, and a lot of math to position everything correctly.
Verified User in Transportation/Trucking/Railroad on G2

The user experience on the website is good. The examples are detailed and easy to understand.
Raj T. on G2

Pricing
$0. There is no paid tier and no commercial product.
Distributed under the ISC licence, whose text grants permission to use, copy, modify and distribute the software for any purpose, with or without fee. Commercial use is permitted without a negotiation.
The npm registry records the licence as ISC and the LICENSE file’s copyright line reads Copyright 2010-2026 Mike Bostock.
Latest published version 7.9.2, released 3 November 2026.
The real cost is engineering time, which its own reviewers and maintainers both say out loud.
Bottom Line
Reach for it only when no library ships what you need and someone on the team writes JavaScript. It is the most capable of the open source data visualization tools here, and the licence costing nothing is not the same as it being cheap.
Free, total control, and the most expensive option here in hours.
Which Data Visualization Tool Should You Choose?
Choose Tableau if:
- Analysts need to change the question as the picture changes, not read a fixed dashboard
- You can test the loop on Tableau Public or Desktop Free Edition first
- An annual per-user contract with at least one Creator licence is acceptable
Choose Datawrapper if:
- A chart has to go out today and be legible on a phone and in a screen reader
- PNG is enough, or you can justify Pro for PDF and SVG
- Your data fits comfortably in a browser editor and does not live in a warehouse
Choose Algoscale if:
- The visualization tool is already bought and the numbers in it still cannot be trusted
- Reports are prepared by hand because nothing underneath is modelled
- One dashboard has to show different rows to different viewers
Choose Plotly if:
- Your analysts already write Python or R and work in notebooks
- A standalone interactive HTML file is a good enough way to share
- You only need the paid tier when apps require private viewers
Choose Flourish if:
- The deliverable is animated, scrolling or presented rather than queried
- Attribution on published pieces is acceptable, because that is the free tier’s condition
- You already have Canva Business, or can move the budget conversation there
Choose Highcharts if:
- Charts ship inside software you sell, so the licence scope is a legal question
- A published per-seat price matters more than a free tier
- Six developer seats or fewer, because above that it is custom-priced
Choose D3.js if:
- No chart library ships what you need to draw
- Someone on the team writes JavaScript and has the time
- You accept building accessibility, legends and responsive behaviour yourself
Skip this category entirely if:
- You need one chart for one slide. A spreadsheet will do it and nobody will know the difference.
- The numbers are disputed rather than badly drawn. A new tool renders the same disagreement in a nicer font.
- You have bought three of these already and nobody uses any of them. That is an adoption problem, and a fourth licence makes it an expensive one.
What’s the Best Data Visualization Tool in 2026?
Datawrapper if a chart has to be published today and be correct on a phone and in a screen reader. Its free tier genuinely publishes, which is rarer in this category than the word free suggests, and accessibility is a default rather than a setting.
Tableau if analysts need to interrogate the data rather than read it – and test that on Tableau Public or Desktop Free Edition before signing an annual contract.
Plotly if your team already writes Python, because the library is free and the chart is interactive in the notebook. Flourish when the story moves, accepting that no paid tier publishes a price. Highcharts when the chart ships inside what you sell, which is the one licensing question this category usually ducks. D3 only when nothing else draws it, and budget the hours rather than the licence.
And if the chart is already right but the numbers reaching it are stale or disputed, none of these is the fix. That is the problem the third entry exists for.
How Algoscale Fixes the Layer Under the Chart
Every tool above draws what it is handed. A chart cannot be fresher than its pipeline or more trustworthy than its model, and no template choice changes either.
A Toronto-based provider of cloud based employee engagement solutions was preparing reports by downloading and cleaning data by hand, with the numbers spread across multiple Salesforce objects – up to two weeks per reporting cycle. Our data engineering team built a unified data model to consolidate those objects, then automated extraction straight into Tableau. The case study records report preparation time reduced from 10 to 14 days to real-time updates, cutting manual effort by 90%.
The second half of that engagement was access, not speed: role-based access controls and user-level permissions, so one dashboard shows each viewer only the rows they are allowed to see. The page reports 100% compliance as the outcome.
- An engagement starts at the report that is wrong, not at a platform programme
- The model and the pipeline are the deliverable; the visualization licence stays yours
- Access is answered once, in the pipeline, instead of per dashboard
- No per-seat licence on the result, so the cost does not grow with the audience
Ready to put this into production?
Algoscale’s data engineers have built and migrated data platforms for retail, fintech and manufacturing teams. Book a free consultation and we will scope yours with you.
Frequently Asked Questions
What are the different types of data visualization tools?
Three, and they are different purchases. Chart editors like Datawrapper and Flourish run in a browser, need no developer, and publish an embed – this is where most people should start. Chart libraries like Highcharts, Plotly and D3.js are code you ship inside your own application, which makes them an engineering decision and, for Highcharts, a licensing one. And analyst workbenches like Tableau sit in between: a drag-and-drop canvas built for exploring a dataset rather than publishing a single picture. Most shortlists go wrong by comparing one of each as though they were alternatives.
How do you choose the right data visualization tool?
Start with who builds the chart, not which charts it draws. If it is a communications or research team with no developer, you need a browser editor. If it is engineers shipping a feature, you need a library, and the next question is immediately the licence – a chart inside software you sell is a different scope from a chart on your intranet. If it is analysts exploring data, you need a workbench with a free route in so you can test the loop. Then check the free tier against what you actually need to ship, because free authoring is common here and free publishing is not.
What are the limitations of data visualization tools?
The one that matters is that every tool here draws what it is given. A chart cannot be fresher than the pipeline behind it or more trustworthy than the model underneath it, so stale or disputed numbers survive any change of tool. The practical limits are narrower and worth reading per entry: Datawrapper’s reviewers report it struggling with large datasets and note it does not connect to data warehouses, Tableau’s recent reviewers report performance degradation on large data, and D3 gives you no accessibility, legends or responsive behaviour unless you build them.
Are free data visualization tools good enough?
Often, but check what free means on each one, because it differs wildly. Datawrapper and Flourish both publish unlimited work on their free plans, with attribution – Datawrapper’s free tier gives you PNG but not PDF or SVG, and Flourish’s comparison table reserves export for the paid tiers entirely. D3.js and the Plotly libraries are free outright under open-source licences with no tier above them to buy. Tableau’s free routes publish only public data or nothing at all. And Highcharts has no commercial free tier – non-commercial use sits under separate terms. The free tier is usually enough until you need private publishing, your own branding, or vector export.


