




Almost everyone who will touch your BI tool is only going to read it. They open a dashboard, look at a number, and close it. How much that person costs is the single line that decides what business intelligence tools actually cost you – and it is the line most comparisons leave out.
The answers are not close to each other. Tableau charges $15 a month for a Viewer and $35 once you need its governance edition. Power BI charges $14 until you buy a capacity big enough to stop charging per reader. Qlik charges nothing for users at all above its entry tier, because it bills for gigabytes instead. Metabase’s open-source edition charges nothing for anyone. Sisense and Looker publish no figure of any kind.
So this comparison of business intelligence tools carries a column no rival page has: what a read-only user costs on each one. Every price here was read on the vendor’s own page on 8 November 2026. Nothing was trialled and no account was created, which is also why you will not see a single screenshot of a logged-in dashboard below.
7 Best Business Intelligence Tools: Quick Comparison
| Tool | Best For | Public Reviews | The Catch | Starting Price | What A Read-Only User Costs | Access |
|---|---|---|---|---|---|---|
| 1Tableau | Enterprise rollouts where seat roles and governance tiers decide the bill | TrustRadius – 8.6 from 2,338 ratings, the largest corpus here; praised for authoring, criticised for licence cost | Every edition boundary raises every seat, Viewer included | $15 Viewer / $42 Explorer / $75 Creator a month, billed annually | $15 a month, or $35 on Enterprise – unless you move to capacity pricing | Free Desktop edition, local only |
| 2Microsoft Power BI | Teams already standardised on Microsoft 365 and Fabric | TrustRadius – 8.5 from 2,243 ratings; criticised on transformation and on the price of public reporting | Pro caps you at 8 refreshes a day and a 1 GB model | $14 Pro / $24 Premium Per User a month, paid yearly | $14 a month, or nothing at Fabric F64 and above | Free Desktop authoring, free Fabric account cannot share |
| 3Algoscale | When the dashboard is fine and the pipeline underneath it is not | Our own case study – Power BI refresh time cut from 45 minutes to 8 after the stack underneath was replaced | A services engagement, so there is nothing to trial | From around $5,000 for a focused four-week project | No per-seat licence on our work – you still license the BI tool | Talk to us |
| 4Qlik Cloud Analytics | Exploring data nobody has modelled yet | TrustRadius – 333 reviews; praised in bake-offs, criticised above 5 GB | Starter’s 10 GB is fixed and cannot be topped up at any price | $300 / $825 / $2,750 a month by capacity, billed annually | Nothing above Starter – the page states no cost for additional users | Talk to sales |
| 5Sisense | Putting analytics inside a product you sell | TrustRadius – 58 written reviews, newest December 2024; the thinnest and stalest corpus here | Two plans, no figure against either one | Not published | Not published | Try free on Self-Serve, talk to us on Enterprise |
| 6Metabase | Small teams that want BI with no per-seat bill | TrustRadius – 70 ratings but only 4 written reviews; too few to call a consensus | Permissions and SSO start at Pro, which is $575 a month | Free open source / $100 / $575 a month, plus per user | Nothing on open source; $6 a user over 5 on Starter, $12 over 10 on Pro | Free open-source download, 14-day trial on paid tiers |
| 7Looker | Organisations that need one governed definition of every metric | TrustRadius – 137 reviews; the recurring theme is a dependency on developers | Two separate bills, platform and users, and neither is published | Not published – all three editions say Call sales | Not published, though a Viewer licence type exists | Talk to sales |
Not sure which of these fits your stack?
Tell us what you are running today and what you need it to do. We will tell you which of these we would pick, and why. We are not going to pitch you.
How We Researched These Business Intelligence Tools
Nothing was trialled and no account was created. Every price, tier, limit and feature below was read on the vendor’s own pricing or documentation page on 8 November 2026. That is also why there is not one screenshot of a logged-in dashboard in this post: six of the seven products need an account to show you anything, and a product tour we did not take is not evidence we can offer you.
The reviews are all from TrustRadius, and every one of them carries TrustRadius’s own Incentivized badge – the reviewer received something for writing it. That is worth knowing before you weigh them. G2 refused the automated requests we made for Sisense and Metabase, so rather than quote a rating we could not open, we left it out.
Two of the seven publish no price at all, and a third publishes a starting figure rather than a rate card. Where a vendor publishes nothing, this post says so plainly instead of guessing, and records what the page does publish instead.
One name is missing on purpose. Apache Superset is cited by more of the pages ranking for this term than Looker is, and it is not here – a second open-source entry would have argued the same case as Metabase. We rank it in our Power BI alternatives round-up instead, where the open-source options are the point.
Four things decided the order:
- What the readers cost – most people who touch a BI tool only read it, so the per-reader line – or the absence of one – sets the bill long before the authoring features do
- Whether the limits are published as numbers – a refresh count, a model size and a capacity ceiling can be planned against; ‘enterprise scale’ cannot, and the gap between those two is where renewal surprises come from
- What happens to the bill as you grow – every product here changes shape at some threshold – an edition, a capacity, a user count – and the useful question is where yours is
- Whether the product is the dashboard or the layer underneath it – a BI tool reads what it is given, so a refresh that takes too long or a number two teams disagree about is usually not a problem the licence can fix
Is Your Problem the BI Tool, or the Data Underneath It?
Most BI shortlists start one step too late. Before comparing products, find your sentence in the left column.
Three of these rows are not solved by any licence on this list.
| What is actually wrong | What to do | Why |
|---|---|---|
| Nobody outside the analytics team can see the numbers | Buy readers, carefully | This is the per-reader line: Tableau $15, Power BI $14, Qlik nothing above Starter, Metabase nothing on open source |
| Two dashboards give two different answers for the same metric | Buy a semantic layer | That is what LookML is for, and it is the only one on this list – entry 7 |
| Analytics has to live inside the product you sell to customers | Buy an embedding platform | Sisense sells embedding as the product; Metabase Pro and Power BI Embedded do it as a feature |
| The dashboard is right but it refreshes too late to act on | Fix the pipeline, not the licence | A dashboard can only be as timely as the data reaching it – this is the row we are in, at number three |
| You already run Power BI and you are costing an exit | Price the alternatives, not the chart | We compare them head to head in our Power BI alternatives round-up, which is the page for that question rather than this one |
| Nobody trusts the numbers because the source data is wrong | Fix the data, not the licence | A faster dashboard shows a wrong number sooner |
| Everyone has a tool already and nobody uses it | None of the above | That is an adoption problem, and a second licence makes it an expensive adoption problem |
- If your sentence is in the first three rows, the comparison below is your shortlist.
- If it is in the last three, buying a different BI tool will reproduce the problem on a new screen.
1. Tableau: Best for Rollouts Where Seat Roles Decide the Bill
What it does: Salesforce’s BI platform, bought as hosted Tableau Cloud or self-managed Tableau Server, licensed per user as Creator, Explorer or Viewer and bounded by a published site count per edition.
Who this is for: Enterprise and upper mid-market teams with more than a hundred report consumers and a BI budget that has to be defended per seat
Tableau’s entire bill can be worked out before a sales call, which is rarer here than it sounds. Creator $75, Explorer $42, Viewer $15, all per user per month and billed annually. Server charges the same three prices as Cloud, so a data-residency requirement does not change the arithmetic.
The number that moves is the edition. Data Management and Advanced Management only arrive at Enterprise, and moving there lifts every seat: a Viewer goes from $15 to $35. Weighing it against Power BI? We take that apart in Tableau vs Power BI.


Key Features
- Three seat roles priced separately, with at least one Creator required per deployment
- A choice of role-based or capacity-based licensing, the second removing the per-Viewer line
- Published site ceilings per edition: 3 on Standard, 10 on Enterprise, 50 on Cloud+
- Self-managed Tableau Server at identical role prices, for residency requirements
Pros and Cons
Pros
- Every seat price and edition boundary is published, so a large rollout can be costed from the pricing page
- Cloud and self-managed Server carry identical role prices, so residency does not change the seat maths
- Capacity-based licensing exists for fluctuating reader audiences and removes the per-Viewer line entirely
- Reviewers describe the authoring layer as something non-specialists pick up, which is what makes a wide rollout survivable
Cons
- Read-only access still consumes a paid licence under role-based pricing
- Reviewers at smaller companies name the licence bill directly as the reason to look elsewhere
- The governance add-ons sit behind Enterprise, and moving there raises every seat – Viewer from $15 to $35
- An annual contract with at least one Creator licence is the floor, so there is no month-to-month way in
What Users Say
It would be nice if view-only didn’t require a license.
Amanda McCombs on TrustRadius

License can become costly for small organizations
Verified User, Analyst in Information Technology (51-200 employees) on TrustRadius

Pricing
Tableau Cloud Standard: Creator $75, Explorer $42, Viewer $15 per user a month, billed annually.
Tableau Cloud Enterprise: Creator $115, Explorer $70, Viewer $35 per user a month, billed annually. This edition is where Data Management and Advanced Management arrive.
Tableau Server charges the identical six figures, so self-managing changes the operating burden rather than the licence cost.
Cloud+ and the Tableau+ Bundle are Contact Sales, with no public figure.
Every deployment needs at least one Creator licence and an annual contract. Tableau Desktop Free Edition authors locally from Excel, CSV and database files, with no sharing. If the rollout is the hard part, that is what our Tableau consulting team is for.
Bottom Line
The right pick when the rollout, not the chart, is the hard part. Price the edition you need before the seats, because the edition moves every seat.
Cost it to the dollar from the pricing page, before anyone calls you.
2. Microsoft Power BI: Best If You Already Pay Microsoft
What it does: Microsoft’s BI service, now sold inside Microsoft Fabric: free authoring in Power BI Desktop, per-user Pro and Premium Per User licences to publish and share, and Fabric capacity when readers should not need licences of their own.
Who this is for: Organisations already on Microsoft 365 with an IT function that buys Microsoft licences, at the point where readers start to outnumber authors
At $14 a seat with free Desktop authoring, Power BI makes the pilot nearly free – and many organisations discover they own it already, because Pro is bundled into Microsoft 365 E5 and Office 365 E5.
What it publishes next is rarer than the price: hard service limits. Pro gives you 8 dataset refreshes a day and a 1 GB model, Premium Per User 48 and 100 GB. The engine-level case against Tableau is a separate argument, made in Tableau vs Power BI.


Key Features
- Free Power BI Desktop authoring, with sharing gated behind a paid per-user licence
- Pro and Premium Per User tiers that differ on refresh frequency, model memory and storage
- Fabric capacity at F64 and above to let readers consume content without per-user licences
- Pro bundled into Microsoft 365 E5 and Office 365 E5, so many organisations already own it
Pros and Cons
Pros
- Pro is $14 a seat and Desktop authoring is free, so a pilot costs one licence
- Pro is already inside Microsoft 365 E5 and Office 365 E5, which is why so many teams find they have it
- The service limits are published as specific numbers rather than an unquantified promise of enterprise scale
- There is a published route to stop paying per reader: Fabric F64 or Premium P1 and above
Cons
- Pro’s eight refreshes a day and 1 GB model limit are low, and clearing them means $24 a seat or a Fabric capacity
- Letting readers in without per-user licences starts at F64 or P1, and a reviewer calls that tier cost-prohibitive
- Reviewers say heavier transformation does not belong in it – one data engineer reports robust ETL is not worth doing there
- Even on a Premium or Fabric capacity you still need a Pro licence to publish, so the per-user line never disappears entirely
What Users Say
The pricing for the tier to have publicly, universally accessible reports was, for a long time, cost-prohibitive.
Verified User, Director in Research & Development (11-50 employees) on TrustRadius

However, if I need to do a more robust ETL, it’s not worth doing it with Microsoft Power BI because it’s cumbersome.
Edson Pinheiro on TrustRadius

Pricing
Power BI Pro: $14.00 per user a month, paid yearly. A free Fabric account covers authoring but cannot share reports. We break the licence types down properly in our guide to Power BI licence types.
Power BI Premium Per User: $24.00 per user a month, paid yearly. A $14.00 add-on steps an existing Pro, M365 E5 or O365 E5 user up to it.
Published limits: 8 dataset refreshes a day on Pro against 48 on Premium Per User; a 1 GB model against 100 GB; 10 GB of storage per licence against 100 TB.
Licence-free reading starts at Fabric F64 or Premium P1, and only in the App Owns Data embedded mode. Below that, every reader is a paid seat.
Power BI Embedded is listed as Variable with no public figure. A Pro licence is still required to publish to any P or F capacity.
Bottom Line
The default if Microsoft is already the stack. Work out where your readers cross the line into a Fabric capacity before you commit to per-seat.
Cheapest to start, and the limits are published so you can see where it stops.
3. Algoscale: Best When the Dashboard Is Not the Problem
What it does: Algoscale is not a tool on this list – it is the data engineering team that implements them. The work is the layer under the dashboard: ingestion, a lakehouse model, schema handling that survives upstream change, and a curated serving layer the BI tool reads from.
Who this is for: Organisations that have already bought a BI licence and are stuck underneath it – a brittle legacy ETL stack, or a refresh window that no longer fits the business day
A report due for a Monday meeting cannot be built from a pipeline that finishes on Monday afternoon, and no edition upgrade moves that deadline. Every product above draws whatever reaches it, on whatever schedule it arrives.
A US insurance provider ran a legacy SSIS and SQL stack that could not carry 100M rows a day. We replaced it with a schema-resilient Delta Lake pipeline feeding Azure Synapse. Because that stack changed, Power BI refresh time fell from 45 minutes to 8 – a result of replacing what sits underneath, not of anything done to Power BI.


Key Features
- A Bronze to Silver to Gold Delta Lake architecture with schema enforcement, ACID transactions and time travel
- Dynamic schema handling, so upstream schema changes do not break the jobs and need no manual fix
- Curated Gold-layer tables published to Azure Synapse, so the BI tool reads a modelled layer rather than raw tables
- Auto-scaling Spark clusters sized for peak batch loads instead of permanently over-provisioned compute
Pros and Cons
Pros
- The evidence is a published, linked engagement with before-and-after numbers rather than a testimonial
- It moves the number a BI buyer actually feels – refresh time – because that one is set by the pipeline and not by which dashboard was chosen
- An engagement can start at one department and one report instead of a platform programme
- A starting figure is published: around $5,000 for a focused project of about four weeks
Cons
- There is nothing to try: no product, no free tier, no trial, nothing you can evaluate in an afternoon
- No rate card – the $5,000 figure is a floor for a narrow scope and rises with sources, modelling, governance and training
- Tool licences are billed separately, so an engagement sits on top of whatever you already pay Microsoft or Salesforce
- No third-party review corpus exists, so there is nothing to read against the case study
What Users Say
82% Reduction in Power BI refresh time – from 45 min to 8 min
Algoscale case study: business intelligence for a US insurance provider

Pricing
From around $5,000 for a focused project of about four weeks – the words on our Power BI consulting page are that a focused Power BI project, such as a set of dashboards on clean data, typically starts around $5,000 and takes about 4 weeks.
No rate card and no free tier. Cost rises with the number of data sources, the modelling, the governance and the training.
Tool licences are billed separately by Microsoft or Salesforce. This is the layer underneath, not a replacement for the BI tool.
Most engagements begin with one department or one use case – a sales dashboard, a financial report – rather than a full rollout.
There is no per-seat licence on the output, so the work does not get more expensive as more people read the result.
Bottom Line
Bring us in when the dashboard is right and late, or when two teams disagree because the data arrives differently. Not when you simply need a cheaper seat.
The answer when the licence is not what is broken.
4. Qlik Cloud Analytics: Best for Data Nobody Has Modelled Yet

What it does: Qlik Cloud Analytics, the product Qlik Sense became, loads data into an associative in-memory engine and is priced by capacity – gigabytes of data for analysis – rather than by seat above its entry tier.
Who this is for: Mid-market to enterprise teams with 25 GB or more of analysable data and far more readers than modellers
Qlik stops charging for people. From the Standard tier up the page states no cost for additional users: you buy gigabytes of data for analysis, and the reader count becomes somebody else’s problem.
The entry tier is a dead end by design. Starter is $300 a month for 10 users and 10 GB, and that 10 GB is fixed – the page says no additional data capacity is available for purchase. The next step is $825.


Key Features
- An associative engine that keeps excluded values on screen in a different colour instead of filtering them out of sight
- Capacity pricing measured in gigabytes of data for analysis, with users uncapped from Standard upwards
- Published app-size ceilings: 5 GB on Starter, 10 GB on Premium, 15 GB as standard on Enterprise and up to 40 GB purchasable
- Per-tier AI question and page-indexing allowances rather than an unmetered assistant
Pros and Cons
Pros
- Users stop being the billing unit above the entry tier: Standard and up state no cost for additional users
- The bill is a fixed annual capacity fee with overage only above plan, which is forecastable in a way consumption pricing is not
- The associative model keeps excluded values visible, which is what makes poking at an unmodelled dataset useful
- Allowances for AI questions and scheduled reports are published per tier instead of left to a sales conversation
Cons
- The entry tier is a dead end by design: Starter’s 10 GB is fixed and no additional data capacity can be bought at all
- A reviewer reports latency once an app handles more than about 5 GB, which is also Starter’s published app-size ceiling
- The step from Standard to Premium is $825 to $2,750 a month for 25 extra gigabytes of capacity
- Enterprise has no public price and starts at 250 GB, so the top of the range is a sales conversation
What Users Say
We have tried a lot of BI software during our PoC phase and Qlik Sense is the most simple to use because despite of some improvements I could suggest, it’s very efficient and simple for making fast and useful insights for our business.
Verified User, Manager in Information Technology (501-1000 employees) on TrustRadius

Sometimes it create issues while handling large amount of data majorly above 5 GB which leads to less efficiency and increase latency of Qlik Sense tool that required enhancement.
Manjul Malhotra on TrustRadius

Pricing
Starter: $300 a month for 10 users and a fixed 10 GB of data for analysis, billed annually. Extra users can be bought; extra capacity cannot.
Standard: $825 a month for 25 GB, billed annually, with no cost for additional users. Capacity is added in 25 GB increments.
Premium: $2,750 a month for 50 GB, billed annually, with capacity in 25 GB or 250 GB packs.
Enterprise is Get a Quote with no public figure, and starts at 250 GB of data for analysis.
App-size ceilings are published per tier: 5 GB on Starter, 10 GB on Premium, 15 GB as standard on Enterprise and up to 40 GB, or 50 GB with an additional purchase.
Bottom Line
Price it on gigabytes, not people. If your reader count is the problem and your data fits in 25 GB, this is the cheapest answer on the page.
The only one here where adding a thousand readers changes nothing on the invoice.
5. Sisense: Best for Analytics You Sell to Your Own Customers
What it does: An embedded-first analytics platform sold through two sales-led plans: analytics you connect, model and put inside your own product by iframe or the Compose SDK, with multi-tenant segregation, white-labelling, and SaaS, dedicated-cloud or on-prem deployment.
Who this is for: Software vendors and regulated enterprises embedding dashboards for their own customers, not for their own staff
Sisense is built for a different buyer. You are not giving dashboards to your colleagues, you are shipping them to your customers inside something you sell. Embedding is the product, not a feature bolted on at the top tier.
It is also the least transparent. Its page carries two plans – Enterprise and Self-Serve – and neither has a figure, a unit or a tier table. What it publishes instead is the compliance surface an embedded vendor gets asked about: HIPAA-ready, multi-tenant, column-level security, a 99.99% SLA.


Key Features
- iframe or Compose SDK embedding into any tech stack
- Multi-tenant architecture with column-level security and an SSO Router
- SaaS, dedicated-cloud or on-prem deployment with a 99.99% Premium SLA on Enterprise
- Bring-your-own-LLM, so AI features stay inside your own governance
Pros and Cons
Pros
- Embedding is the product, with iframe or Compose SDK into any stack and full white-labelling on top
- The compliance surface an embedded vendor gets asked about is published – HIPAA-ready, multi-tenant, column-level security, SSO Router
- Deployment choice reaches on-prem and dedicated cloud with a 99.99% Premium SLA, which matters when it is your customers’ data inside
- Bring-your-own-LLM keeps the AI features inside your own governance
Cons
- No price at all: neither plan carries a figure, a unit or a tier table
- Reviewers report the licensing conversation, not the software, as the hard part of buying it
- The economics bend at user volume – a reviewer says large user counts mean more logins and lead to cost and maintenance problems
- The review corpus is thin and stale: 58 written reviews on TrustRadius, the newest from December 2024
What Users Say
Handling our extreme large datasets for example in marketing teams makes it sometimes in slower performance which annoys us.
Dhruv Vig on TrustRadius

I did not face any issue regarding its technicality, we easily came across its usage. But while purchasing the tool I face some complexities in terms of licensing which overburdened me.
Craig Varghese on TrustRadius

Pricing
Not published. The plans page lists exactly two plans and neither carries any figure, tier table or unit price.
Enterprise is sold to enterprises and regulated industries, described as HIPAA-ready with multi-tenant architecture, column-level security and an SSO Router.
Self-Serve is aimed at startups and growing teams, connects to any warehouse, database or cloud app, and offers a Try free route.
Enterprise adds full white-labelling, premium support, a dedicated customer success manager and a 99.99% Premium SLA, on SaaS, dedicated cloud or on-prem.
Bottom Line
Shortlist it when analytics is something you sell. Expect the price conversation to be the long part.
Strong at the job it is built for, and silent about what it costs.
6. Metabase: Best for BI With No Per-Seat Bill at All
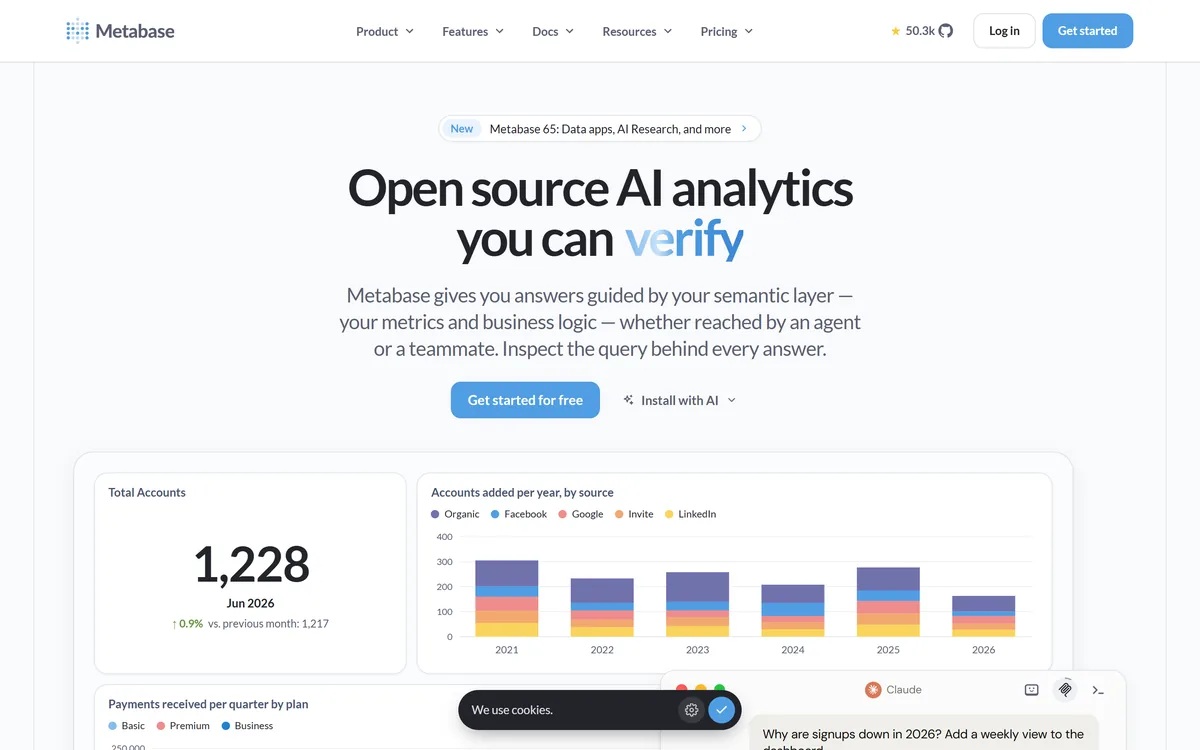
What it does: An open-source BI tool packaged as a Java JAR or a Docker image. The Open Source edition is free with unlimited users and self-hosted; the paid tiers add permissions, SSO, caching, embedding and support, billed as a base fee plus a per-user rate.
Who this is for: Teams with an engineer willing to own a container and no budget for per-seat BI
The open-source edition is genuinely free for unlimited users and runs from one Docker image or a Java JAR anywhere Java runs. For a team whose objection to every other row on this page is the seat price, that is the whole answer.
The bill arrives with governance. Row and column level permissions, SSO, caching controls and embedding all start at Pro, which is $575 a month before a single user is added. There is no middle: Starter at $100 does not carry them either.


Key Features
- An Open Source edition that is free for unlimited users and self-hosts from a single Docker image or Java JAR
- A query builder and a SQL editor over 20+ databases and warehouses
- Row and column level permissions, SSO and caching controls from the Pro tier upwards
- Usage-based add-ons for transforms, storage and AI rather than those costs being folded into the seat price
Pros and Cons
Pros
- The free edition really is free for unlimited users, and self-hosts from one Docker image wherever Java runs
- Per-user add-on rates are published, so a thirty-person Starter bill is arithmetic rather than a quote
- Paying more at the top does not unlock features – Pro and Enterprise are the same software, so the premium buys support and procurement
- The variable costs are itemised to the run and the row instead of hidden in a tier
Cons
- The governance features are not in the free edition: row and column permissions, SSO and caching start at Pro, which is $575 a month before any users
- Embed viewers count as users, so a customer-facing deployment multiplies the per-user line
- A reviewer who self-hosted reports the non-Docker install was the hard path
- The review corpus is very small: 70 ratings on TrustRadius with only 4 written reviews, which is too few to call a consensus
What Users Say
I did both container and system direct installation, and direct deployment became a bit challenging.
Verified User, Manager in Research & Development (51-200 employees) on TrustRadius

In terms of scalability, as we grow, there will be inevitable questions over how well we can grow with Metabase.
Samuel Allen on TrustRadius

Pricing
Open Source: free, with free unlimited users, self-hosted.
Starter: $100 a month, or $90 a month billed yearly at $1,080 a year, with the first 5 users included and $6 per user a month after that.
Pro: $575 a month, or $517.50 billed yearly at $6,210 a year, with the first 10 users included and $12 per user a month after that. This is the first tier with row and column permissions, SSO and embedding.
Enterprise: custom pricing, starting at $20,000 a year. Feature-wise it is the same software as Pro; what differs is support, procurement and an air-gap option.
Usage sits outside the tier: 1,000 transform runs included then $0.01 a run, storage from $2 per 1M rows with the first million free. Both your own team and the users of your embeds count as users.
Bottom Line
The cheapest honest answer if an engineer will keep a container alive. Check whether you need row-level permissions before you believe the free number.
Free until you need governance, and then it is $575 a month.
7. Looker: Best When Two Dashboards Disagree
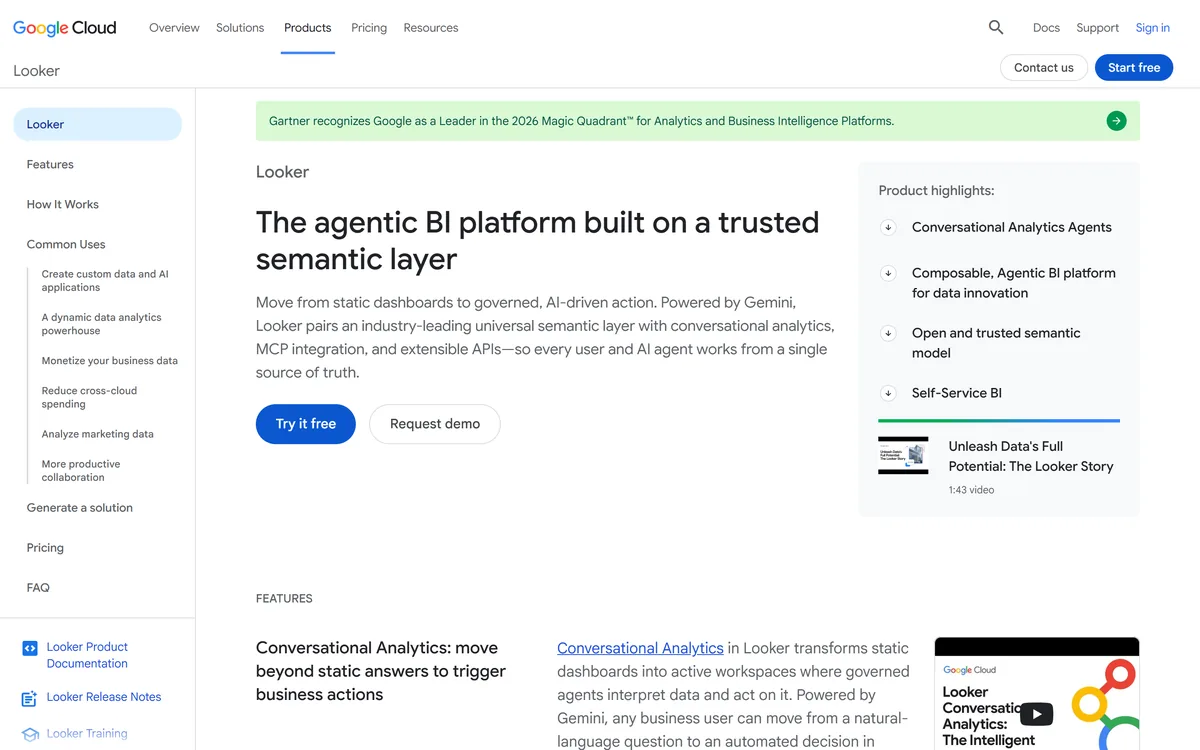
What it does: Google Cloud’s BI platform, built around LookML – a modelling language used to create semantic data models that generate every query’s SQL. Platform and users are licensed separately, in three editions and three user types, and every edition is quote-only.
Who this is for: Organisations past the point where one metric has two answers, typically Google Cloud and BigQuery shops with an analytics engineering function
Looker answers a problem the other six do not even address. LookML defines a metric once and generates the SQL behind every query from that definition, so two dashboards cannot quietly disagree about what revenue means. It is the only semantic layer on this list.
It costs you twice over. Nothing is priced – all three editions say Call sales – and the model needs someone who maintains it, which is what reviewers keep describing: changes, filters and upkeep all route back through a developer.


Key Features
- A LookML semantic model, version-controlled in Git, that generates the SQL behind every query
- Three licence types – Developer, Standard, Viewer – drawn tightly enough that a Viewer cannot author
- Platform and user licences billed separately, with 10 Standard and 2 Developer users included per instance
- Published monthly API-call ceilings per edition: 1,000, 100,000 and 500,000 query-based calls
Pros and Cons
Pros
- The semantic layer is the product: LookML defines a metric once and generates the SQL, so two dashboards cannot quietly disagree
- The model lives in Git as project files, so metric definitions get code review and a history
- Licence types are drawn tightly, so read-only users cannot drift into authoring and the seat mix stays honest
- Edition limits are published even though the prices are not – included users and API-call ceilings are on the pricing page
Cons
- No public price at any tier: all three editions say Call sales, and no per-user rate is published
- There are two bills, platform and users, so even a per-seat figure would not tell you the cost
- Reviewers consistently report a developer dependency – changes and filters need technical help, and dashboards need developer time to maintain
- Standard is scoped at fewer than 50 users and allows only 1,000 query-based API calls a month, so it outgrows quickly
What Users Say
However, if you need more complicated dashboards, or add filters, or make changes, techincal support is always required and most of the times you can’t self-serve.
Verified User, Project Manager in Marketing (51-200 employees) on TrustRadius

The setup of reports is a specialized skill that requires custom training.
Daniel Dammerman on TrustRadius

Pricing
Not published. All three platform editions – Standard, Enterprise and Embed – show Call sales for an annual commitment, and no per-user rate is published for Developer, Standard or Viewer licences.
There are two bills: platform pricing to run a Looker instance, and user pricing to license individual users. A per-seat figure alone would not tell you the cost.
Every edition includes one production instance, 10 Standard Users and 2 Developer Users. Standard is scoped by Google at fewer than 50 users.
Published ceilings, even without prices: query-based API calls run to 1,000 a month on Standard, 100,000 on Enterprise and 500,000 on Embed.
From 1 February 2027, Conversational Analytics beyond the included allocation bills at $3.00 per 1M input and $20.00 per 1M output data tokens. Until 31 January 2027 it is promotional with no allocation limit.
Bottom Line
Buy it when disagreeing numbers cost more than licences do. Budget for the analytics engineer as well as the quote.
A semantic layer sold without a price and run by specialists.
Which Business Intelligence Tool Should You Choose?
Choose Tableau if:
- The rollout is hundreds of readers and the budget has to be defended seat by seat
- You need the whole bill costed before anyone talks to a salesperson
- Data residency means some of it has to be self-managed at the same price
Choose Microsoft Power BI if:
- Microsoft 365 is already the stack and Pro may already be in your E5 licence
- 8 refreshes a day and a 1 GB model are enough, or you can justify a Fabric capacity
- You want to start a pilot this week for the price of one seat
Choose Algoscale if:
- The dashboard is correct and arrives too late to act on
- A legacy ETL stack breaks whenever an upstream schema changes
- Two teams disagree because the data reaches them differently, not because the chart is wrong
Choose Qlik Cloud Analytics if:
- Readers vastly outnumber authors and the per-seat line is the whole objection
- You have 25 GB or more of data to analyse, because Starter’s 10 GB cannot be topped up
- Nobody has modelled the data yet and the work is exploratory
Choose Sisense if:
- The dashboards go inside a product you sell, for your customers rather than your staff
- On-prem, HIPAA or multi-tenant segregation is on the requirements list
- A sales-led price conversation is normal procurement for you
Choose Metabase if:
- An engineer will own a Docker container and the seat price is the objection
- Row and column permissions, SSO and embedding are not requirements yet
- You want the variable costs itemised rather than bundled into a tier
Choose Looker if:
- Two dashboards already disagree about the same metric and it is costing you
- You have, or will hire, someone to maintain a semantic model in Git
- Quote-only pricing on two separate bills is acceptable
Skip this category entirely if:
- Nobody uses the BI tool you already own. A second licence will be an expensive way to reproduce that.
- The complaint is that the numbers are wrong. Nothing on this page validates your source data – it will show you the same wrong number, faster.
- You have one analyst and one database. A SQL client and a scheduled email is a defensible reporting stack at that size, and it costs nothing.
What Are the Best Business Intelligence Tools in 2026?
Power BI if you already pay Microsoft, which is most organisations reading this. $14 a seat, free Desktop authoring, and published limits that tell you exactly where you will outgrow Pro – eight refreshes a day and a 1 GB model.
Tableau when the rollout is the hard part and the bill has to be defended before a sales call. It is the only platform here that publishes every seat price and every edition boundary, and the place to be careful is that moving to Enterprise for governance lifts every Viewer from $15 to $35.
Qlik when readers are the problem, because above Starter it charges for gigabytes and states no cost for additional users. Metabase when there is no budget at all and an engineer to keep a container alive. Sisense when analytics is something you sell. Looker when two dashboards disagree and that disagreement costs more than a quote-only licence will.
And if the dashboard is already right but arrives too late, or the numbers differ because the data reaches each team differently, none of these licences is the fix. That is the problem the third entry exists for.
How Algoscale Fixes the Layer Under the Dashboard
The refresh window is set upstream of the licence. If the pipeline feeding a dashboard takes 45 minutes, no tier on this page makes the number arrive sooner.
A prominent US insurance provider ran a legacy SSIS and SQL stack that could not carry 100M rows a day. Our data engineering team replaced it with a schema-resilient Delta Lake pipeline – Bronze to Silver to Gold, with schema enforcement and ACID transactions – publishing curated tables into Azure Synapse for Power BI to read. The case study records an 82% reduction in Power BI refresh time, from 45 minutes to 8, which is what replacing the stack underneath did rather than anything changed in Power BI itself.
The same engagement reports a 5X growth in active analysts, from 10 to 50 concurrent users, and a 40% reduction in monthly compute cost from auto-scaling the Spark clusters rather than running them permanently over-provisioned. The page reports those as outcomes of the engagement and we quote them the same way.
- Dynamic schema handling, so an upstream change does not break the jobs and need a manual fix
- A curated Gold layer in the warehouse, so the BI tool reads a modelled layer rather than raw tables
- Auto-scaling compute sized for peak batch loads instead of permanently over-provisioned
- No per-seat licence on the work, so the cost does not grow with the number of people reading the result
Ready to put this into production?
Algoscale’s data engineers have built and migrated data platforms for retail, fintech and manufacturing teams. Book a free consultation and we will scope yours with you.
Frequently Asked Questions
What are the different types of business intelligence software?
They split three ways, and the split decides your bill before any feature does. Per-seat platforms like Tableau and Power BI charge for every person who looks, which makes the reader count the main cost driver – $15 and $14 a month respectively. Capacity-priced platforms like Qlik charge for the volume of data instead and state no cost for additional users above their entry tier. And open source business intelligence tools like Metabase charge nothing at all until you need governance features, at which point the jump is to $575 a month – which is why free business intelligence tools are worth checking against what you actually need to lock down. Which shape fits you depends less on the charts than on how many people read them.
What are the limitations of business intelligence software?
The hard one is that every tool here renders what it is handed. If a report is correct but lands after the meeting it was for, no edition upgrade fixes it, because the delay is upstream of the licence. The same goes for two dashboards disagreeing about one metric – only Looker’s semantic layer addresses that, and it is quote-only. The practical limits are published and worth reading: Power BI Pro allows 8 dataset refreshes a day and a 1 GB model, Qlik’s Starter tier is capped at a fixed 10 GB that cannot be topped up at any price, and Metabase’s free edition has no row-level permissions or SSO.
What are the benefits of business intelligence tools?
The real one is that people who cannot write SQL stop queuing behind people who can. Beyond that, the benefit worth pricing is governance: a single definition of a metric, permissions that match your org chart, and an audit trail. Those are also the features that sit behind the higher tiers on almost every product here, which is why the honest version of this question is what the benefit costs. On this list that is $35 a Viewer on Tableau Enterprise, a Fabric F64 capacity on Power BI, or $575 a month on Metabase Pro.
How does business intelligence software work?
It connects to your databases and warehouses, models what it finds into tables and measures, and renders the result as dashboards other people read. The modelling step is where the products differ most: Looker generates every query’s SQL from a LookML model held in Git, Qlik loads data into an associative in-memory engine, and Power BI and Tableau each build models inside their own authoring tools. What none of them do is fix the data arriving – which is why a warehouse or lakehouse with a curated serving layer usually comes first.


