


Every list of marketing analytics tools puts Google Analytics, HubSpot and Adobe in the same table and sorts them by stars. That table is useless, because those three answer three different questions. One tells you what happened on your website, one tells you which contact did it, and one is sold by a salesperson who will not tell you the price.
So this comparison is sorted by the question each tool answers, and judged on what each vendor publishes before you talk to anyone. Of the seven entries here, one prints a complete rate card, three print an entry price and then go custom, and two – Analytics 360 and Adobe Analytics – publish nothing at all. The seventh is us, and we do not publish a price either, which is stated in our own row rather than hidden in it.
Everything below was read at the vendor’s own pricing or documentation page on 5 November 2026. Nothing was trialled and no account was created. The limits matter more than the headline figures: the number that decides which of these digital marketing analytics tools you outgrow is usually three rows down a feature table, not on the pricing card.
7 Best Marketing Analytics Tools: Quick Comparison
| Tool | Best For | Public Reviews | The Catch | Starting Price | Access |
|---|---|---|---|---|---|
| 1Google Analytics | Web and campaign reporting on no budget | TrustRadius – 8.3 from 4,020 ratings; praised for traffic detail, criticised for CRM-level data | Explorations sample above 10M events per query | Free; 360 unpublished | Free tier, no card |
| 2HubSpot Marketing Hub | Reporting joined to the CRM | TrustRadius – 8.4 from 2,321 ratings; praised for one platform, criticised for social | Attribution is Enterprise-only, and onboarding is a separate fee | $0 / $20 seat / $800 mo / $3,600 mo | Free for 2 users, no card |
| 3Algoscale | Joining ad spend, CRM and product data | Our own case study – 80% time savings for a US marketing agency on manual reporting | A services engagement, not a product | Scoped per project | Talk to us |
| 4Amplitude | Product behaviour, on a real free tier | TrustRadius – 8.7 from 170 ratings; praised for behavioural depth, criticised for custom dashboards | Growth and Enterprise publish nothing | Free 2M events; Plus from $0 | Free tier, no card, no time limit |
| 5Mixpanel | Pricing your own usage before a sales call | TrustRadius – 8.3 from 256 ratings; praised for funnels, criticised for cost | Warehouse-imported events count on the same meter | Free 1M events; Growth from $0 | Free tier, no card |
| 6Funnel | Getting ad spend out of the ad platforms | G2 – 4.5 from 297 reviews; praised for ease, criticised at large data volumes | Warehouse and BI destinations start on the $600 tier | From $300/mo, billed annually | Book a demo |
| 7Adobe Analytics | Enterprises already inside Experience Cloud | TrustRadius – 8.2 from 1,014 ratings; praised for attribution depth, criticised for the learning curve | No published price, and the pricing URL is dead | Not published | Book a demo |
Not sure which of these fits your stack?
Tell us what you are running today and what you need it to do. We will tell you which of these we would pick, and why. We are not going to pitch you.
How We Researched These Marketing Analytics Tools
We started from what ranks. Google returns an AI Overview and nine organic results for this term, and the AI Overview sorts the category the same way this post does: web and product analytics, CRM and marketing automation, data aggregation and warehousing, SEO, and dashboards. The six vendors ranked here – seven entries including our own – were picked to cover the first three, because those are the three a marketing team actually has to choose between.
Nothing was trialled, and no account was created. Every price, limit and feature below was read on the vendor’s own pricing or documentation page on 5 November 2026. That means there is no dashboard screenshot and no hands-on narrative anywhere in this post, and where a figure is a promotion rather than a list price we say so.
Prices move with where you are standing. HubSpot’s pricing page bills in local currency by default; the figures here are the US dollar view, switched with the currency selector on the page itself. Google and Adobe publish no price at all, so we recorded what they do publish instead – Google’s 360 feature-limits table, and Adobe’s demo booking.
Reviews come from TrustRadius for five entries and G2 for Funnel, chosen for whichever site carries a real corpus for that product. Every quote links to the page it came from, and the screenshot under each reviewed entry’s first quote shows the reviewer and the sentence together. Several reviews carry an Incentivized badge, which is visible in the capture and worth reading as what it is. Two of the four questions at the foot of this post come from Google’s own related searches for this term and from the vendors’ own pricing FAQs; the other two are the questions this research kept running into.
Four things decided the order:
- Can you see the price – of the six vendors ranked here, one publishes a complete rate card, three publish an entry price and then go custom, and two publish nothing at all
- Which limit bites first – the number that forces an upgrade is rarely on the pricing card – it is sampling, contacts, events or validated assets, three rows down a feature table
- What question it answers – web traffic, product behaviour, campaign attribution and the data layer underneath are four different jobs, and a tool that is right for one is wrong for another
- What the bill does when you grow – per-event, per-contact and per-capacity pricing behave completely differently in the month a campaign goes well
Web, Product, Attribution or Pipeline: Which One Is Your Problem?
Most of the frustration with marketing analytics tools comes from buying the wrong category. A team that cannot tell which campaign produced revenue buys a product analytics tool, instruments it for six weeks, and still cannot tell which campaign produced revenue – because the tool was never going to know what a campaign cost.
The table below is the real fork. Read down the left column until you find your sentence, and the row tells you which half of this list to read. The last row is the one no product on this list covers.
| What you are trying to fix | What to buy | Why |
|---|---|---|
| Nobody can say how many people came to the site last month, or from where | Web analytics | Google Analytics answers this for nothing, and the first limit you hit will be exploration sampling at 10M events per query |
| We cannot see what people do inside the product after they sign up | Product analytics | Amplitude and Mixpanel are built on behavioural events, with free tiers of 2 million and 1 million events a month |
| We cannot connect a campaign to a deal | CRM-attached reporting | HubSpot’s reporting sits on the contact records, though multi-touch attribution is an Enterprise line item |
| Every number is assembled by hand from six ad platforms | A marketing data pipeline | Funnel maintains the connectors so an ad platform’s API change is not your problem, from $300 a month. The same job for application and database sources is a different category, covered in our data integration tools comparison |
| The ad spend, the CRM and the product data will not reconcile, and nobody owns the join | Data engineering | This is the layer the tools above all assume somebody else built, and it is what we do |
- If two of those rows are your sentence, you need two tools, and the second one is probably the pipeline.
- If all five are your sentence, start with the pipeline. Instrumenting four tools on top of data nobody trusts just gives you four disagreeing dashboards.
1. Google Analytics: Best for Web Reporting on No Budget
What it does: Free web and app analytics that almost every marketing team already has, with a paid 360 tier that raises the limits rather than adding a different product.
Who this is for: Teams reporting on web and campaign performance who have not yet hit a sampling or export limit
Google Analytics is first for a boring reason: it is free, it is already installed, and for most marketing teams it is enough. The useful question is not whether to use it, but which limit will push you off it – and Google publishes that answer in detail while refusing to publish a price.
The limit is sampling. A standard property samples explorations above 10 million events per query; a 360 property samples above 1 billion. Same report, a hundredfold difference. That is the point where a large site’s numbers quietly stop being exact.


Key Features
- A free tier that collects without a per-event bill
- BigQuery export on the free tier, so the raw event data can leave the tool
- Explorations, funnels and path analysis, sampled above 10M events per query on standard
- A 360 tier that raises limits and adds an SLA rather than adding a different product
Pros and Cons
Pros
- Free, and already installed in most organisations
- Raw event export to BigQuery on the free tier, which nothing else free here offers
- Feeds conversion events straight back into Google Ads
Cons
- Google publishes no price for 360, so the upgrade starts with a sales call
- Explorations sample above 10M events per query on standard, which quietly changes the numbers on a large site
- Reports on sessions and events, not on accounts and deals
What Users Say
These reports are extremely useful especially when making the case to amend sections. However, I do believe it could be made easier to get these reports or maybe a way to automatically output a report on a given timeframe so we don’t have to keep manually doing this process.
Scott William Halewood on TrustRadiusDigital Experience Coordinator in Marketing at York St John University, 201-500 employees, 6 March 2025. Carries TrustRadius’s Incentivized badge.

The platform is not ideal for CRM-level data or granular decision-making.
Connor Bolin on TrustRadiusAssociate Director of Analytics at KlientBoost, 51-200 employees, 6 March 2025, badged Incentivized. The same review praises pushing events to Google Ads and connecting GA4 to BigQuery.
Pricing
Free for standard properties, with no per-event bill and BigQuery export included – the only free tier here that lets the raw events leave the tool.
Analytics 360: not published. Sold through Google sales or a reseller. The $150,000 a year figure repeated in other comparisons appears on no Google page.
The limits 360 raises, from Google’s own table: custom dimensions and metrics 50 to 125, user properties 25 to 100, key events 30 to 50, daily BigQuery export 1 million events to billions.
The practical cost of the free tier is the sampling: above 10 million events per query, an exploration is an estimate.
Bottom Line
Start here, and know which limit pushes you off it: sampling at 10M events a query, or the 1-million-event daily BigQuery export.
Free, and good enough for longer than most people expect. Watch the sampling line, not the price line.
2. HubSpot Marketing Hub: Best for Reporting Joined to the CRM
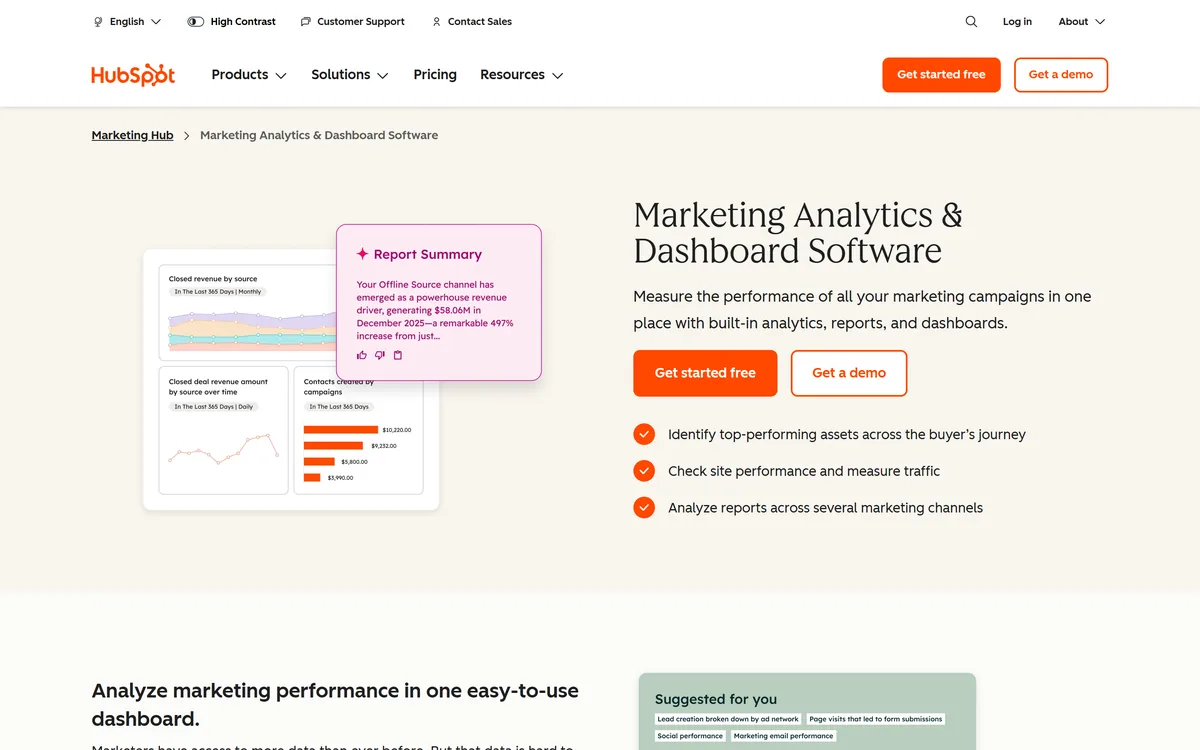
What it does: Marketing automation with reporting attached to a CRM, so campaign numbers and contact records sit in one system.
Who this is for: SMEs running email and lead capture across several tools who want one system of record
Price every HubSpot tier before you shortlist it, because the published figure and the first invoice are different numbers. Free for two users, $20 a seat on Starter, $800 a month on Professional, $3,600 on Enterprise – and then the footnotes.
Under each upper card sits a required one-time onboarding fee the monthly price excludes: $3,000 on Professional, $7,000 on Enterprise. The second trap is attribution. Multi-touch revenue attribution – the reason most teams go shopping for marketing attribution tools at all – is Enterprise-only.


Key Features
- Campaign, email and web reporting on the same contact records as the CRM
- Custom report builder: 100 reports and 10 million events per query on Professional, 500 and 100 million on Enterprise
- Multi-touch revenue attribution and customer journey analytics on Enterprise
- A free tier that includes the CRM, so the reporting has something to report on
Pros and Cons
Pros
- The join between campaign data and contact records is already built
- A real free tier for two users, with no card
- The only entry here that publishes a figure at every tier, from the free plan to Enterprise
Cons
- A required one-time onboarding fee of $3,000 on Professional and $7,000 on Enterprise sits outside the advertised price
- Attribution, the reason most teams buy marketing analytics, is Enterprise-only
- Marketing contact allowances are small at every tier and the email send limit is pinned to them
What Users Say
It great if you’re an SME that is starting to struggle with using multiple tools to collect, store, and contact leads. Building Zaps is great but having it all in one platform saves hours – and mistakes! It’s not a good fit if you only have a few hundred customers or rarely send emails.
Richard Sweeting on TrustRadiusMarketing Manager at The Web Advisors, 11-50 employees, 28 July 2026. Quoted as published.

We wouldn’t recommend it to use for social campaigns as its algorithms and feautres availables are not comparable with other social tools like google ads/meta ads.
Vishesh Valeja on TrustRadiusSenior Analyst in Marketing at doperogue, 11-50 employees, 5 March 2026, rated 6 out of 10. Quoted as published, spelling included.
Pricing
Free for up to 2 users, no card.
Starter: $20 per seat per month list price, currently advertised from $7 on a limited-time new-customer discount with the $20 struck through beside it. 1,000 marketing contacts.
Professional: $800 a month billed annually ($890 monthly), including 3 core seats, extra seats from $45. 2,000 marketing contacts, 100 custom reports, 10 million events per reporting query. Plus a required one-time $3,000 onboarding fee.
Enterprise: $3,600 a month, including 5 core seats, extra seats from $75. 10,000 marketing contacts, 500 custom reports, 100 million events per query, and the only tier with multi-touch attribution. Plus a required one-time $7,000 onboarding fee.
Email sends are a multiple of the contact tier rather than a separate allowance: 5x on Starter, 10x on Professional, 20x on Enterprise.
Bottom Line
The right answer when the CRM is the reporting layer – as long as you price the onboarding fee and the Enterprise line for attribution before you commit.
Buy it for the join between campaigns and contacts, not for the attribution, unless Enterprise is already in the budget.
3. Algoscale: Best for Joining Ad Spend, CRM and Product Data
What it does: The data engineering team that builds the warehouse and the pipelines under these tools, so spend, CRM and product data answer one question together.
Who this is for: Agencies and in-house marketing teams running several ad platforms plus a CRM, where reporting is assembled by hand and no one owns the join between the sources
Algoscale is not a tool on this list – it is the data engineering team that implements them. We are including it here because the question that follows “which tool?” is usually “who is going to build this?”, and in most shortlists nobody answers it.
A US marketing agency came to us with manual reporting and data silos blocking CAC, ROI and ROAS. We pulled Google Ads, Facebook Ads, Shopify and Instagram into one warehouse with a secure dashboard on top. Our case study records the result: cutting the weekly reporting cycle by 80%.


Key Features
- Custom pipelines from the ad platforms a connector catalogue already covers, plus the ones it does not
- One warehouse behind the dashboards, so CAC, ROI and ROAS are computed once rather than per tool
- Secure dashboards with user management, built to serve more than one agency from the same platform
- Campaign and competitor analytics as a continuous feed, on a separate retail engagement: cart-abandon and repeat-order baselines, competitor site crawling and price tracking
Pros and Cons
Pros
- Answers the question none of the tools above answer: who joins ad spend to CRM to product data, and where that join lives
- The reporting-cycle outcome is published as a before and after on our own case-study page, not as a capability claim
- No per-event or per-MTU meter, so the bill does not move when a campaign spikes traffic
Cons
- A services engagement, not a product: no free tier, no trial, no rate card
- Overkill when one ad platform and one CRM cover the whole reporting need – buy Funnel’s connector subscription and stop
- You still license the analytics tool on top; this is the layer underneath it, not a replacement for GA4 or Mixpanel
From Our Case Study
Custom pipelines pulled Google Ads, Facebook Ads, Shopify and Instagram into one warehouse with a secure dashboard on top, cutting the weekly reporting cycle by 80%.
Algoscale case study – a US marketing agencyThe summary line from our own case-study page. The same page’s impact block states the figure as 80% time savings.

Pricing
Scoped per project. No rate card – the same answer Adobe Analytics and Analytics 360 give, and the opposite of Funnel’s published $300.
No per-event, per-MTU or per-contact meter, so a campaign that spikes traffic does not change the invoice.
The engagement is the pipelines, the warehouse and the dashboard layer. The analytics tool on top is still yours to license.
Built to serve more than one team or client at once: in the case study’s words, “the solution was designed to serve multiple agencies simultaneously, amplifying its scalability and usability”.
Bottom Line
Bring us in when the answer has to span ad spend, CRM and product data and nobody owns the join – the layer the tools above all assume somebody else built.
The right call when the reporting is assembled by hand every week and the numbers still disagree.
4. Amplitude: Best for Product Behaviour on a Free Tier
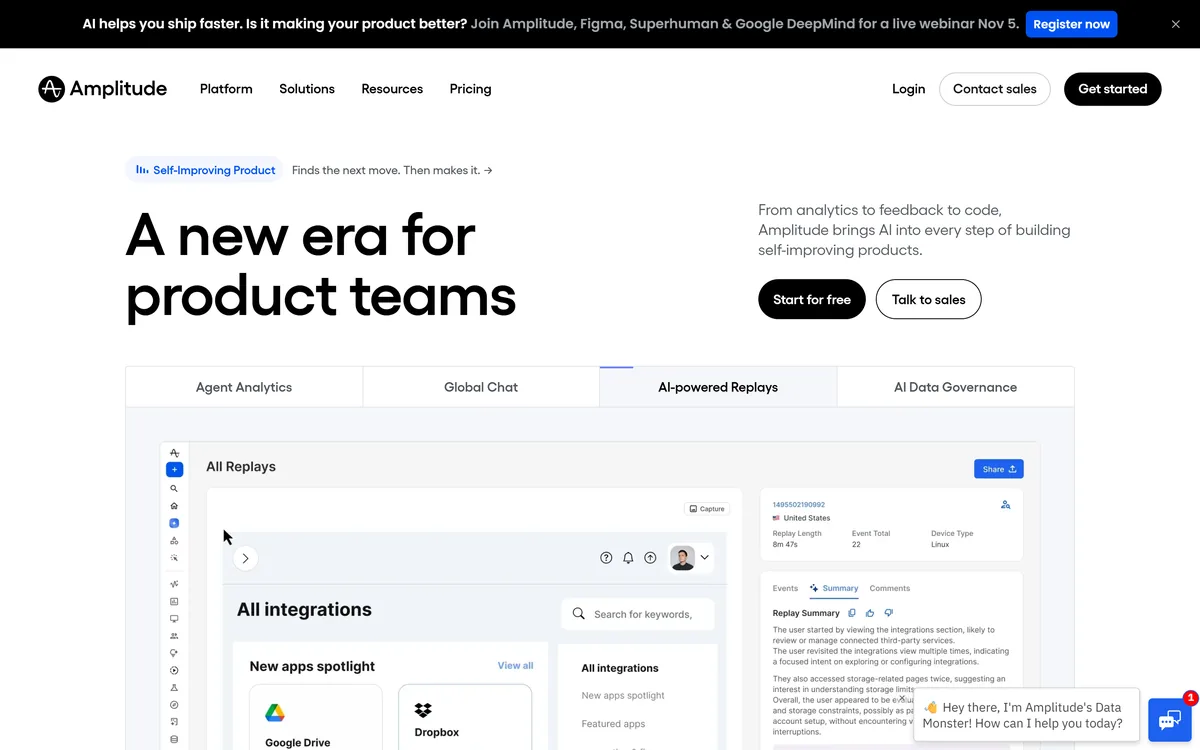
What it does: Product analytics built around behavioural events, with a free tier large enough to run a real product on.
Who this is for: Product and growth teams instrumenting an app, who need seats for everyone and a bill that does not move
Amplitude has the most generous free tier here, and says in writing that it is not a trap: 2 million events a month, unlimited seats, no card. From its own FAQ – “It’s not a trial. There’s no time limit. You can use Amplitude for free as long as it fits your needs.”
Unlimited seats is the quiet part. Analytics rationed by licence stops being used, because the person who needs the answer is never the person with the login. What Amplitude will not tell you is what a campaign cost: this is product behaviour, not ad spend.


Key Features
- 2 million events a month free, with unlimited seats and no time limit
- Session replay, feature flags and web experimentation in the same product
- Cohort comparison and correlation analysis on funnel drop-off
- A published annual comparison chart by event-volume tier
Pros and Cons
Pros
- The largest capped free event allowance here – 2 million a month, double Mixpanel’s
- Unlimited seats on the free plan, so analytics is not rationed by licence
- Plus prices by event volume with no overage penalty, which is rare in this category
Cons
- Growth and Enterprise publish nothing, so the tiers most companies land on need a sales call
- Built for product behaviour, not ad spend: it will not tell you what a campaign cost
- Highly customised dashboards take real engineering effort, by its own reviewers’ account
What Users Say
It may not be suitable for scenarios where you need to slice and dice data into highly customizable dashboards as that requires significant effort from technical teams.
Manan Kumar on TrustRadiusProduct Manager at Atlassian, 5001-10,000 employees, 13 February 2023, rated 9 out of 10. Carries TrustRadius’s Incentivized badge.

Amplitude is used as our premier product analytics tool for the LXME mobile app, helping us understand quantitative behavior of our users.
Shreyans Dhingra on TrustRadiusProduct Manager at LXME, 11-50 employees, 22 July 2022, rated 10 out of 10 and badged Incentivized.
Pricing
Free: 2 million events a month, unlimited seats, no card, no time limit. Includes session replay, A/B tests, feature flags and AI analytics.
Plus: starts at $0 and scales with event volume, with no overage penalties or renewal spikes.
Growth and Enterprise: custom. No figure is published for either, and these are the tiers most companies land on.
Amplitude publishes an annual comparison chart – itself against Mixpanel and PostHog, by event-volume tier up to 20 million, on an axis running to $30,000 a year. Read it as a shape: it prints no figure for any single tier.
Startups with under $10M in funding and fewer than 20 employees get one free year on Growth.
Bottom Line
The free tier is the argument. Take it for product behaviour, and expect a sales call the day you need Growth.
Take the free tier on its own merits. The paid ladder goes quiet at Growth, which is where most teams end up.
5. Mixpanel: Best for Pricing Your Own Usage First
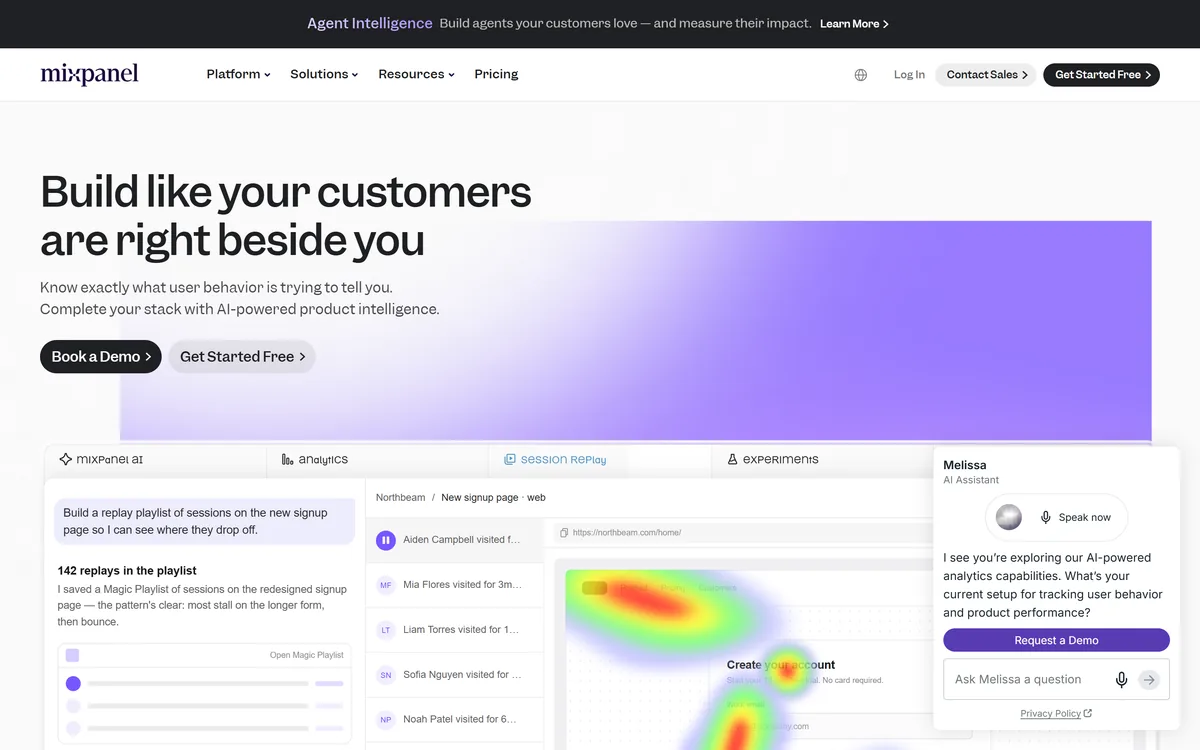
What it does: Product analytics priced per event, with the per-event breakdown published rather than hidden behind a demo.
Who this is for: Teams who need to forecast an analytics bill without a procurement cycle
Mixpanel is for anyone who has to put a number in a budget before they are allowed to buy. Its pricing page carries a working estimator that prints an annual cost against an event volume you choose, and states its annual saving in dollars – $480 a year – rather than a percentage.
The trap is the unit, and it catches teams who think they have outsmarted it: events imported through a warehouse connector count toward the event limit exactly like any other. If the plan was to pipe history in from the warehouse and dodge the meter, it is not a plan.


Key Features
- A published per-event rate card with a cost estimator on the pricing page
- 1 million events a month free, unlimited seats
- Funnels, retention and cohort analysis as the core of the product
- Warehouse connectors, with warehouse events counted on the same meter
Pros and Cons
Pros
- You can price your own usage before talking to anyone
- Unlimited seats on every plan, including free
- The free tier runs forever rather than for fourteen days
Cons
- Priced per event, so the month a campaign works is the month the bill moves
- Warehouse-sourced events are metered like any other, which surprises teams who plan around it
- Session replays and events are separate allowances, so a replay-heavy product meters twice
What Users Say
Mixpanel is great for creating sales funnels, finding new trends, and tracking our events.
Rober Thendrickson on TrustRadiusAgile Developer in Information Technology at Wipro, 10,001+ employees, 13 March 2022, rated 9 out of 10. Carries TrustRadius’s Incentivized badge.

I would like it to be a little more accessible, the costs are somewhat high. Although we still pay for it because it is representative of our work, it would be great to have slightly cheaper access.
Carlos Begazo on TrustRadiusSales Manager at Safe Travel Cartagena, 51-200 employees, 25 April 2022, rated 9 out of 10. Carries TrustRadius’s Incentivized badge.
Pricing
Free forever: up to 1 million events a month, unlimited seats, 10,000 session replays a month, no card.
Growth: starts at $0, first 1 million events free, additional events billed on the published breakdown, up to 20 million events a month. Save $480 a year with annual billing.
Enterprise: up to 1 trillion events a month, quoted.
Events imported through a warehouse connector count toward the same limit as every other event.
Retention: Free and Growth keep logs for 90 days, Enterprise for two years. Automatic delayed deletion of ingested data defaults to two years on all three plans.
Companies under five years old with up to $8M in funding, who have redeemed no other offer, get their first year free.
Bottom Line
The one tool here you can budget for on your own. Check what your event volume actually is first, including anything you plan to pipe in from a warehouse.
Buy it if the finance conversation has to happen before the sales conversation.
6. Funnel: Best for Getting Ad Spend Out of the Ad Platforms
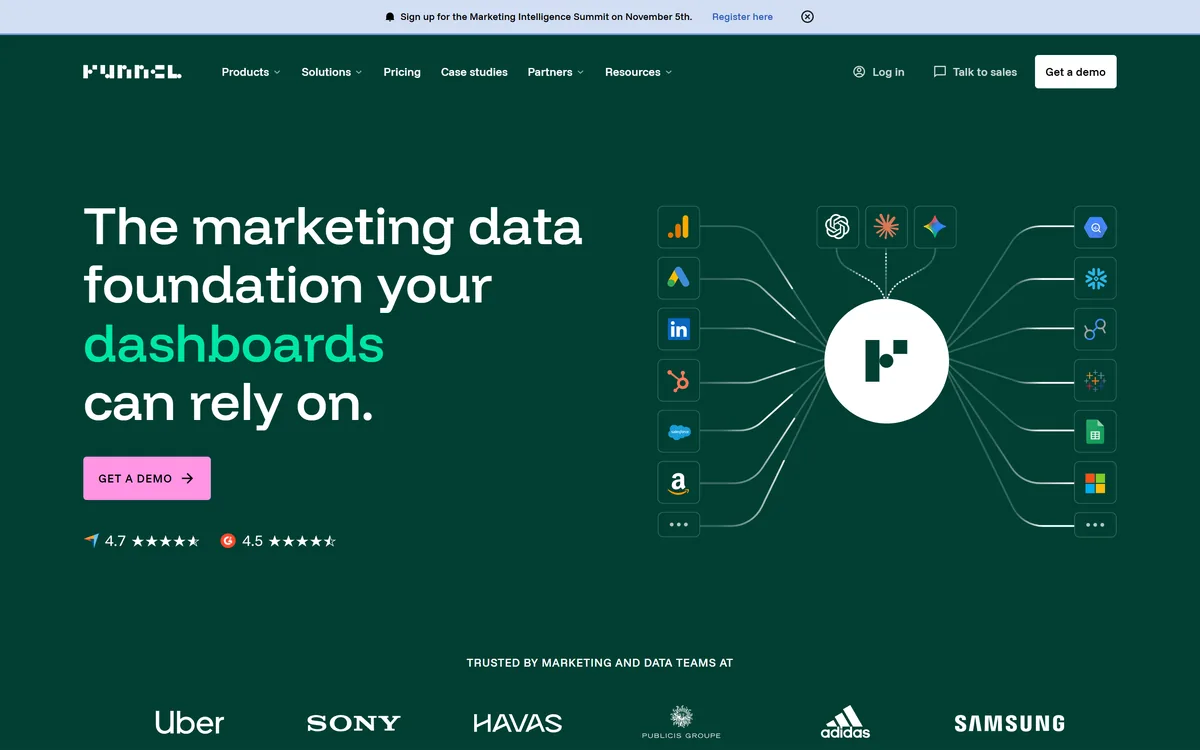
What it does: A marketing data platform that collects spend and performance data from ad platforms and sends it, modelled, to a warehouse or a BI tool.
Who this is for: Marketing teams and agencies pulling spend from many ad platforms into one place
In the data-layer half of this list, Funnel is the one vendor that prints a floor: $300 a month billed annually for 117 connectors, $600 for 579. The pricing model is the unusual part. You buy capacity, not usage, and capacity moves between connectors as the channel mix changes.
Read the tier boundary before you budget $300. Power BI, Tableau, BigQuery and Amazon S3 as destinations all start on Business. If the plan is to land this data in a warehouse, the entry price is $600.


Key Features
- 600+ maintained connectors to ad, social and commerce platforms
- Destinations into BigQuery, Amazon S3, Power BI and Tableau on the Business tier
- Capacity-based pricing that can be moved between connectors without buying more
- Funnel Measure for marketing mix modelling, sold as an add-on on top of Business
Pros and Cons
Pros
- A published entry price, which Adobe and Analytics 360 do not have
- The bill does not move when a campaign spikes volume
- Connectors are maintained by the vendor, so an ad platform’s API change is not your problem
Cons
- $300 a month is the floor, and the warehouse and BI destinations start at $600
- It moves and models marketing data; it is not where you analyse product behaviour
- Reviewers note the exploration tool slows on very large datasets
What Users Say
Data exploration is fast and responsive, although very large datasets sometimes require us to narrow the date range or number of fields.
André L. M. on G2Global Data and Tech Associate Director for Cartier and Richemont, mid-market, 15 October 2026, rated 4.5 out of 5.

Funnel.io is a complete game-changer for anyone who needs to build marketing dashboards without a developer or engineering background.
Tian L. on G2Small business, 20 October 2026, rated 5 out of 5. Badged Incentivized and sourced from a seller invite, which G2 shows on the review.
Pricing
Starter: from $300 a month, billed annually. 117 connectors, 13 destinations.
Business: from $600 a month, billed annually. 579 connectors, 46 destinations, and the first tier with BigQuery, Amazon S3, Power BI and Tableau as destinations – if Power BI is where this lands, our Power BI alternatives comparison is the companion read.
Enterprise: quoted. Funnel counts 600+ connectors across the platform.
Billing is capacity, not usage. In Funnel’s own words: “Flexpoints are part of your contract, not a usage meter. You pay for the capacity you’ve purchased, and that doesn’t change based on how much data runs through your setup.”
Funnel Measure, its marketing mix modelling product, is not included at either price – on Business it is sold as an add-on.
Worth knowing before you find it yourself: G2’s vendor-supplied block lists $400 and $800 for the same two tiers. The vendor’s own page is the figure quoted here.
Bottom Line
Buy it to stop maintaining ad-platform connectors. Budget for Business if the data has to reach a warehouse or Power BI.
The sane answer when six ad platforms are being copied into a spreadsheet every Monday.
7. Adobe Analytics: Best for Enterprises Already Inside Experience Cloud
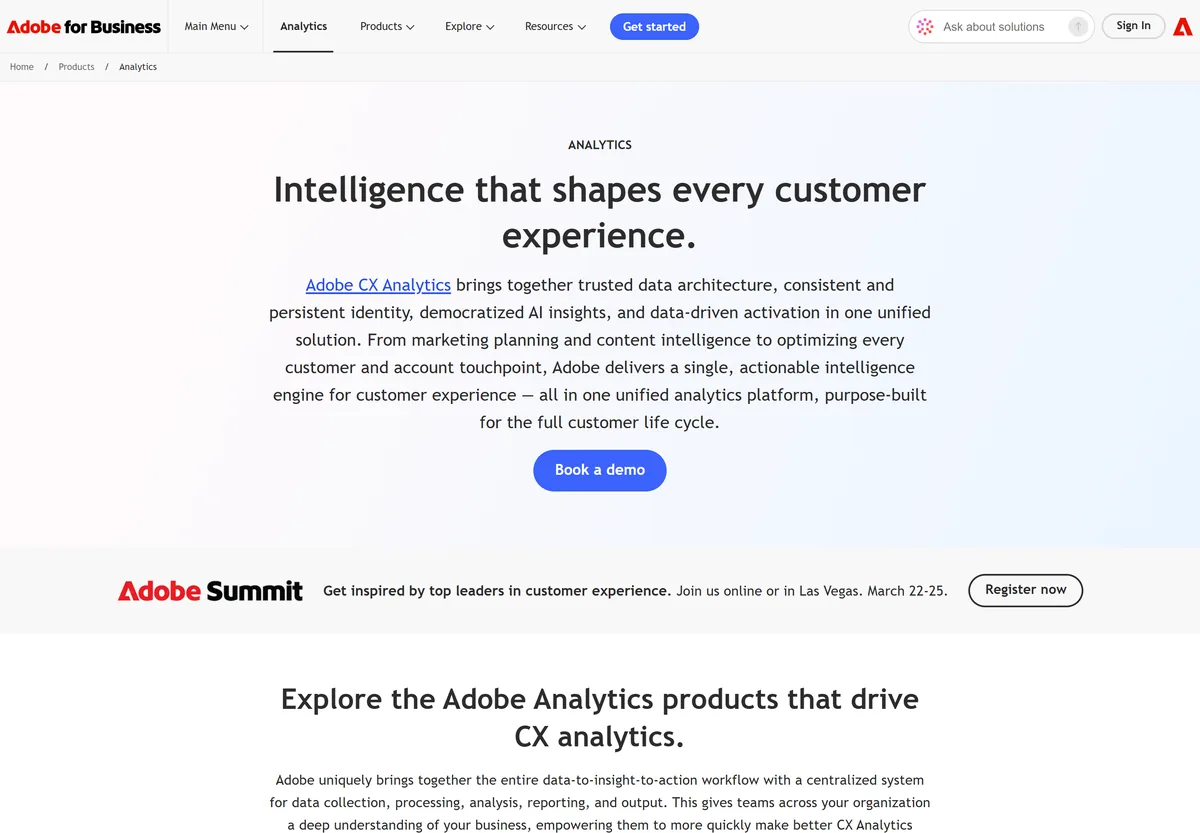
What it does: Enterprise digital experience analytics, sold as part of Adobe’s customer experience suite and quoted per deal.
Who this is for: Enterprises tracking behaviour across many properties who already license Adobe Experience Cloud
Adobe sits last on transparency, which is what this comparison measures, rather than on the product. There is no pricing page: the URL that should hold one returns a page that cannot be found, and the product page offers a demo and no figure.
Its reviewers say something more useful than the marketing does. They describe extending it well past the marketing website – an enrolment portal, a student portal, internal employee sites – which the free tools here do not attempt. They also describe a real learning curve.


Key Features
- Behavioural tracking across web properties, portals and internal sites
- Attribution across marketing channels as a first-class part of the product
- Segmentation and classification of web traffic for reporting
- Sold and licensed inside Adobe Experience Cloud rather than on its own
Pros and Cons
Pros
- Depth of segmentation and attribution that the free tools do not attempt
- Extends beyond marketing sites to portals and internal applications, by its users’ account
- Part of a suite, so identity and activation are already joined up if you own the rest of it
Cons
- No published price of any kind: every evaluation starts with a demo booking
- The published pricing URL is dead, so even the shape of the deal is undocumented
- Implementation and customisation are an enterprise project, not a signup
What Users Say
It does an excellent job of outlining every step of the user journey, as well as giving a good, strong framework to work with as it relates to attribution, attribution of marketing data, and marketing channels.
Eric Andrew Hansen on TrustRadiusDigital Analytics Program Director at Western Governors University, 5001-10,000 employees, 8 May 2026. Carries TrustRadius’s Incentivized badge. The same review describes extending it to the enrolment and student portals.

It has the ability to drill down into multiple domains and compile a comprehensive dashboard. It could improve the ability to analyze bot activity more.
Tara Tomasko on TrustRadiusMarketing Operations Specialist at AVEVA, 1001-5000 employees, 22 April 2026, rated 9 out of 10 and badged Incentivized.
Pricing
Not published. No figure appears anywhere on Adobe’s product page, and business.adobe.com/products/analytics/pricing.html returns a page that cannot be found.
The product page offers Book a demo and Contact us. There is no self-serve route and no trial.
Licensed inside Adobe Experience Cloud, now marketed as Adobe CX Analytics, so the real question is usually what the suite costs rather than what the analytics costs.
No edition, no tier and no floor is stated anywhere, which makes it the only entry here whose shape of deal is entirely undocumented.
Bottom Line
The enterprise answer, and the least transparent one on this list. Shortlist it if you already own Experience Cloud; otherwise the demo is the whole evaluation.
Worth the demo only if Experience Cloud is already a line in your budget. Otherwise you will spend a quarter finding out what it costs.
Which Marketing Analytics Tool Should You Choose?
Choose Google Analytics if:
- The budget is zero and the question is about web traffic
- You want the raw events in BigQuery without paying for the privilege
- Your site is small enough that 10 million events a query is not a ceiling
Choose HubSpot Marketing Hub if:
- The CRM is already the system of record and the reporting should live beside it
- You can price the one-time onboarding fee alongside the monthly figure
- Attribution is either not needed yet, or Enterprise is in the budget
Choose Algoscale if:
- Ad spend, CRM and product data have to agree and currently do not
- Reporting is assembled by hand every week and nobody owns the join
- You need the warehouse built once rather than a connector subscription per tool
Choose Amplitude if:
- The question is about behaviour inside the product, not spend outside it
- Everyone needs a login and you refuse to ration analytics by seat
- 2 million events a month covers you for now and you accept a sales call later
Choose Mixpanel if:
- You have to put a defensible number in a budget before anyone will approve it
- Your event volume is known and will not triple without warning
- Funnels and retention are the reports you actually open
Choose Funnel if:
- Six ad platforms are being copied into a spreadsheet every Monday
- A bill that ignores data volume is worth more to you than the lowest floor
- You can budget $600 rather than $300, because the warehouse destinations start there
Choose Adobe Analytics if:
- You already license Adobe Experience Cloud
- Attribution depth across many properties is the requirement
- A procurement cycle and a demo are a normal way for you to buy software
Skip this category entirely if:
- Your whole marketing operation is one ad platform and a mailing list. A free GA4 property and an afternoon will answer every question you currently have.
- You only need campaign analytics tools for one channel. HubSpot’s free tier or GA4 covers that, and you can upgrade when a limit actually bites.
- One pipeline is the whole problem. A connector subscription beats an engagement here – Funnel at $300 a month is cheaper than anybody’s time, including ours.
What’s the Best Marketing Analytics Tool in 2026?
Google Analytics, for most teams reading this – because it is free, it is already installed, and the free BigQuery export means choosing it does not trap your data. The honest caveat is the one Google publishes itself: above 10 million events per query, your explorations are estimates.
Mixpanel if the budget conversation comes first. It is the only tool here with a working estimator on its own pricing page, so you can price your own event volume before anyone has to approve anything. Amplitude if you need the larger free tier – 2 million events a month against Mixpanel’s 1 million – and can live with Growth being a sales call.
HubSpot is the pick when the CRM is the reporting layer, priced honestly: $800 a month plus $3,000 of required onboarding on Professional, and attribution only at $3,600. Funnel when the problem is six ad platforms, at $600 rather than $300 if the data has to reach a warehouse. Adobe if you already own Experience Cloud, and only then, because nothing about the deal is published.
And if the real problem is that none of these numbers agree with each other – the ad platform says one thing, the CRM another, the product a third – no tool on this list fixes that. Somebody has to build the layer where they are reconciled. That is the row we are in, at number three.
How Algoscale Builds the Layer Under These Tools
Every tool above assumes the data arriving in it is already correct, already joined, and already means the same thing it meant last quarter. That assumption is where marketing reporting actually breaks.
For a US-based marketing agency serving corporate and Fortune 500 clients, our data engineering team built the pipelines that make the assumption true: Google Ads, Facebook Ads, Shopify and Instagram extracted into one warehouse, a secure dashboard and user-management system on top, and a design that serves several agencies from the same platform. The case study records an 80% time saving against a starting point of manual reporting and data silos obstructing CAC, ROI and ROAS.
If your team is three tools deep and still arguing about which number is right, the next thing to buy is not a fourth tool.
- Custom pipelines from the ad and commerce platforms you actually run, including the ones a connector catalogue does not cover
- One warehouse behind the dashboards, so CAC, ROI and ROAS are computed once rather than per tool
- Secure dashboards with user management, built to serve more than one team or client at a time
- Campaign and competitor analytics as a continuous feed – on a separate engagement for a retail business, cart-abandon and repeat-order baselines, competitor crawling and price tracking
- No per-event or per-contact meter, so a campaign that works does not raise the bill
Ready to put this into production?
Algoscale’s data engineers have built and migrated data platforms for retail, fintech and manufacturing teams. Book a free consultation and we will scope yours with you.
Frequently Asked Questions
What are the best free marketing analytics tools?
Three of the seven here have a genuine free tier rather than a trial. Google Analytics is free for standard properties, with BigQuery export included and no per-event bill – though explorations sample above 10 million events per query. Amplitude gives 2 million events a month with unlimited seats, and states in its own FAQ that it is not a trial and has no time limit. Mixpanel gives 1 million events a month with unlimited seats and 10,000 session replays. HubSpot’s free tier is real but capped at two users. Funnel and Adobe Analytics have no free tier at all.
What is the difference between web analytics and product analytics?
Web analytics answers what happened on a site – sessions, sources, conversions – and Google Analytics and Adobe Analytics are built for it. Product analytics answers what people did inside a product after they arrived, as a stream of behavioural events, and that is Amplitude and Mixpanel. The practical tell is the unit you are billed in: web analytics tools meter properties and reports, product analytics tools meter events. Neither one knows what a campaign cost, which is why a marketing data pipeline is a third category rather than a feature of the first two.
How much do marketing analytics tools cost?
It splits three ways, and the split is not where most people expect. Published in full: HubSpot – $0 free for two users, $20 a seat on Starter, $800 a month on Professional plus a required $3,000 onboarding fee, $3,600 a month on Enterprise. Published up to a point: Amplitude, Mixpanel and Funnel all print an entry price – a free tier, a free tier, and $300 a month respectively – and then switch to Custom or quoted at the top. Not published at all: Analytics 360 and Adobe Analytics, both of which require a sales conversation. The $150,000-a-year figure for Analytics 360 that circulates in other comparisons does not appear on any Google page.
What are flexpoints, and why does Funnel price that way?
Flexpoints are purchased capacity rather than a usage meter. Funnel’s own pricing page puts it plainly: “You pay for the capacity you’ve purchased, and that doesn’t change based on how much data runs through your setup.” Capacity can be reallocated between connectors, accounts and destinations – pause a connector you have stopped using, free its flexpoints, connect something else. It matters because every other metered tool in this comparison bills by volume, so a campaign that works raises the invoice. With capacity pricing it does not.